Glencore PLC
LSE:GLEN

Decide at what price you'd be comfortable buying and we'll help you stay ready.

|
Johnson & Johnson
NYSE:JNJ
|
US |

|
Berkshire Hathaway Inc
NYSE:BRK.A
|
US |

|
Bank of America Corp
NYSE:BAC
|
US |

|
Mastercard Inc
NYSE:MA
|
US |

|
UnitedHealth Group Inc
NYSE:UNH
|
US |

|
Exxon Mobil Corp
NYSE:XOM
|
US |

|
Pfizer Inc
NYSE:PFE
|
US |

|
Nike Inc
NYSE:NKE
|
US |

|
Visa Inc
NYSE:V
|
US |

|
Alibaba Group Holding Ltd
NYSE:BABA
|
CN |

|
JPMorgan Chase & Co
NYSE:JPM
|
US |

|
Coca-Cola Co
NYSE:KO
|
US |

|
Verizon Communications Inc
NYSE:VZ
|
US |

|
Chevron Corp
NYSE:CVX
|
US |

|
Walt Disney Co
NYSE:DIS
|
US |

|
PayPal Holdings Inc
NASDAQ:PYPL
|
US |
 Glencore PLC
Cash from Financing Activities
Glencore PLC
Cash from Financing Activities
Glencore PLC
Cash from Financing Activities Peer Comparison
Competitors Analysis
Latest Figures & CAGR of Competitors
| Company | Cash from Financing Activities | CAGR 3Y | CAGR 5Y | CAGR 10Y | ||
|---|---|---|---|---|---|---|
|
|
Glencore PLC
LSE:GLEN
|
Cash from Financing Activities
-$984m
|
CAGR 3-Years
58%
|
CAGR 5-Years
-25%
|
CAGR 10-Years
N/A
|
|
|
A
|
Alpha Exploration Ltd
XTSX:ALEX
|
Cash from Financing Activities
$1.9m
|
CAGR 3-Years
-11%
|
CAGR 5-Years
N/A
|
CAGR 10-Years
N/A
|
|
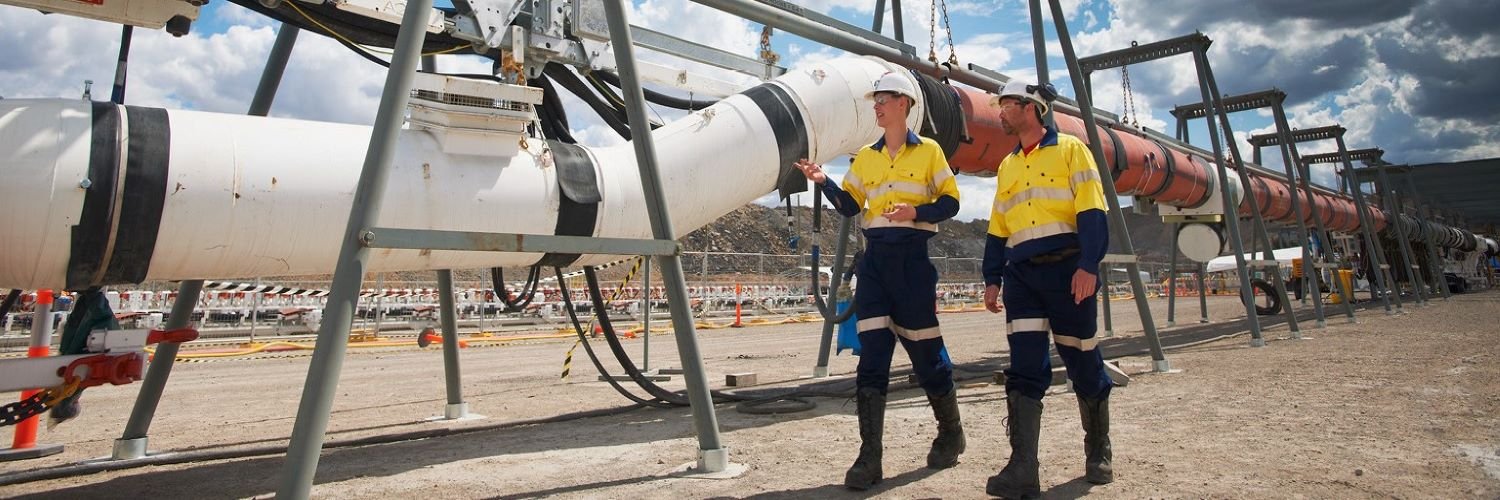
Glencore PLC
Glance View
Glencore PLC, a colossus in the commodities universe, operates at the intersection of mining, metals production, and commodity trading. Founded in 1974 by Marc Rich as a small metal and oil merchant, the company has since expanded into a behemoth influencing global supply chains and market movements. Glencore's strategy is deeply entrenched in its vast global presence, encompassing over 150 mining and metallurgical sites. The company extracts a wide array of minerals and metals, from copper and cobalt to nickel and zinc, catering to the diverse needs of industries from technology to infrastructure. As a vertically integrated entity, Glencore’s business model extends beyond mere extraction; it involves refining and transporting these commodities, enabling it to capture value across the entire supply chain. What uniquely distinguishes Glencore is its robust trading capabilities. Operating as one of the world's largest commodity traders, the company leverages its in-depth market insight and logistical prowess to arbitrate market inefficiencies. By actively trading in oil, gas, coal, and agricultural products, it connects producers with consumers, while skillfully mitigating geopolitical and market risks. This division, fueled by information flow and strategic positioning, not only complements Glencore’s mining operations but also cushions its financial performance against the inherent volatility of raw material prices. Through this dual approach—mining for direct commodity revenues and trading for strategic margin enhancement—Glencore secures its standing as a formidable force in the global commodities landscape.
See Also
What is Glencore PLC's Cash from Financing Activities?
Cash from Financing Activities
-984m
USD
Based on the financial report for Dec 31, 2025, Glencore PLC's Cash from Financing Activities amounts to -984m USD.
What is Glencore PLC's Cash from Financing Activities growth rate?
Cash from Financing Activities CAGR 5Y
-25%
The average annual Cash from Financing Activities growth rates for Glencore PLC have been 58% over the past three years , -25% over the past five years .
