
Mowi ASA
OSE:MOWI

Decide at what price you'd be comfortable buying and we'll help you stay ready.

|
Johnson & Johnson
NYSE:JNJ
|
US |

|
Berkshire Hathaway Inc
NYSE:BRK.A
|
US |

|
Bank of America Corp
NYSE:BAC
|
US |

|
Mastercard Inc
NYSE:MA
|
US |

|
UnitedHealth Group Inc
NYSE:UNH
|
US |

|
Exxon Mobil Corp
NYSE:XOM
|
US |

|
Pfizer Inc
NYSE:PFE
|
US |

|
Nike Inc
NYSE:NKE
|
US |

|
Visa Inc
NYSE:V
|
US |

|
Alibaba Group Holding Ltd
NYSE:BABA
|
CN |

|
JPMorgan Chase & Co
NYSE:JPM
|
US |

|
Coca-Cola Co
NYSE:KO
|
US |

|
Verizon Communications Inc
NYSE:VZ
|
US |

|
Chevron Corp
NYSE:CVX
|
US |

|
Walt Disney Co
NYSE:DIS
|
US |

|
PayPal Holdings Inc
NASDAQ:PYPL
|
US |
 Mowi ASA
Cash from Investing Activities
Mowi ASA
Cash from Investing Activities
Mowi ASA
Cash from Investing Activities Peer Comparison
Competitors Analysis
Latest Figures & CAGR of Competitors
| Company | Cash from Investing Activities | CAGR 3Y | CAGR 5Y | CAGR 10Y | ||
|---|---|---|---|---|---|---|
|
|
Mowi ASA
OSE:MOWI
|
Cash from Investing Activities
-€804.6m
|
CAGR 3-Years
-20%
|
CAGR 5-Years
-23%
|
CAGR 10-Years
-16%
|
|

|
Orkla ASA
OSE:ORK
|
Cash from Investing Activities
kr3.2B
|
CAGR 3-Years
N/A
|
CAGR 5-Years
N/A
|
CAGR 10-Years
N/A
|
|

|
Leroy Seafood Group ASA
OSE:LSG
|
Cash from Investing Activities
-kr1.4B
|
CAGR 3-Years
-16%
|
CAGR 5-Years
-1%
|
CAGR 10-Years
-8%
|
|

|
SalMar ASA
OSE:SALM
|
Cash from Investing Activities
-kr2B
|
CAGR 3-Years
9%
|
CAGR 5-Years
12%
|
CAGR 10-Years
-11%
|
|

|
Austevoll Seafood ASA
OSE:AUSS
|
Cash from Investing Activities
-kr1.8B
|
CAGR 3-Years
-3%
|
CAGR 5-Years
-6%
|
CAGR 10-Years
-8%
|
|
|
A
|
Aker Biomarine ASA
OSE:AKBM
|
Cash from Investing Activities
-$16.8m
|
CAGR 3-Years
33%
|
CAGR 5-Years
-52%
|
CAGR 10-Years
N/A
|
|
Mowi ASA
Glance View
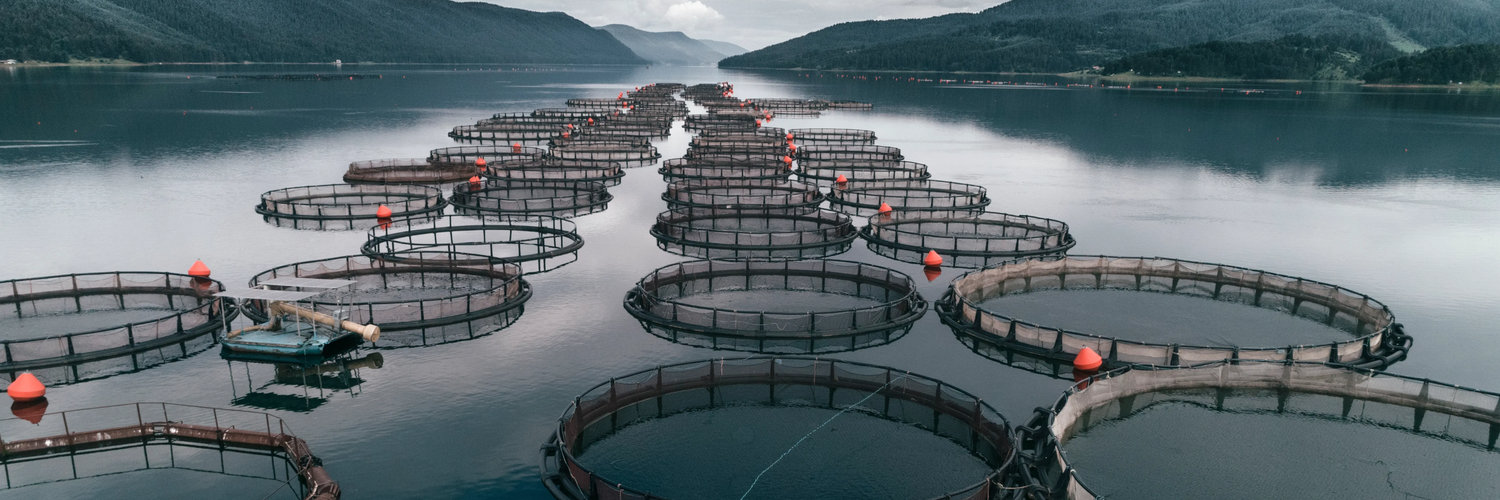
Mowi ASA, formerly known as Marine Harvest, holds its place as a titan in the global seafood industry, distinguishing itself primarily in the salmon farming sector. This Norwegian giant weaves together a complex tapestry of operations, anchored in the sustainable and efficient farming of Atlantic salmon. Positioned strategically from Norway to Chile and Canada to Ireland, Mowi commands an impressive feat of aquatic agriculture. Through advanced aquaculture techniques, such as controlled feeding and enhanced breeding for optimal growth, the company minimizes its environmental footprint while ensuring consistent quality. It also employs sophisticated data analytics to monitor and manage the health of its stock, underscoring its commitment to sustainability and innovation. The company's economic engine roars to life through several revenue streams. At its core, Mowi generates income by breeding, growing, and harvesting salmon, which is then processed into various forms, including fresh, frozen, and smoked products, catering to diverse consumer preferences. Mowi also maneuvers through other markets by providing feed and genetic services, reflecting its vertically integrated business model. Retail partnerships and its own brand presence in supermarkets worldwide amplify its reach, further cementing its financial stability. With an eye on expanding its portfolio, Mowi commits to research and development to enhance production efficiencies and reduce costs, thereby strengthening its profitability. The result is a finely tuned operation that capitalizes on the soaring global demand for healthy, protein-rich seafood, allowing Mowi ASA to not only survive but thrive at the forefront of the aquaculture industry.
See Also
What is Mowi ASA's Cash from Investing Activities?
Cash from Investing Activities
-804.6m
EUR
Based on the financial report for Dec 31, 2025, Mowi ASA's Cash from Investing Activities amounts to -804.6m EUR.
What is Mowi ASA's Cash from Investing Activities growth rate?
Cash from Investing Activities CAGR 10Y
-16%
Over the last year, the Cash from Investing Activities growth was -142%. The average annual Cash from Investing Activities growth rates for Mowi ASA have been -20% over the past three years , -23% over the past five years , and -16% over the past ten years .
