
ASML Holding NV
AEX:ASML

Decide at what price you'd be comfortable buying and we'll help you stay ready.
|
S
|
Synspective Inc
TSE:290A
|
JP |
|
D
|
Digihost Technology Inc
XTSX:DGHI
|
CA |

|
IAMGOLD Corp
TSX:IMG
|
CA |
|
M
|
Miraculum SA
WSE:MIR
|
PL |

|
Bravida Holding AB
STO:BRAV
|
SE |
|
N
|
NBTM New Materials Group Co Ltd
SSE:600114
|
CN |
|
B
|
BBB Foods Inc
NYSE:TBBB
|
MX |
|
N
|
Nouveau Monde Graphite Inc
NYSE:NMG
|
CA |
 ASML Holding NV
EPS (Diluted)
ASML Holding NV
EPS (Diluted)
ASML Holding NV
EPS (Diluted) Peer Comparison
Competitors Analysis
Latest Figures & CAGR of Competitors
| Company | EPS (Diluted) | CAGR 3Y | CAGR 5Y | CAGR 10Y | ||
|---|---|---|---|---|---|---|
|
|
ASML Holding NV
AEX:ASML
|
EPS (Diluted)
€24
|
CAGR 3-Years
20%
|
CAGR 5-Years
24%
|
CAGR 10-Years
23%
|
|

|
ASM International NV
AEX:ASM
|
EPS (Diluted)
€14
|
CAGR 3-Years
23%
|
CAGR 5-Years
21%
|
CAGR 10-Years
N/A
|
|

|
BE Semiconductor Industries NV
AEX:BESI
|
EPS (Diluted)
€1
|
CAGR 3-Years
-16%
|
CAGR 5-Years
1%
|
CAGR 10-Years
10%
|
|
ASML Holding NV
Glance View
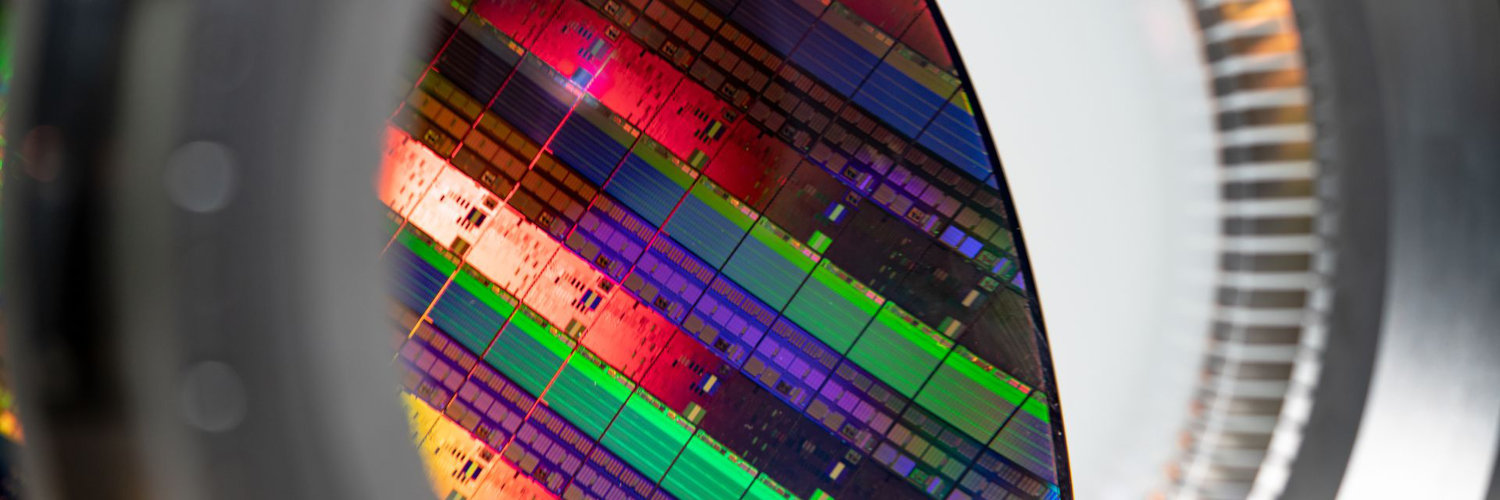
In the intricate and high-stakes world of semiconductor manufacturing, ASML Holding NV stands as a pivotal player, commanding both respect and influence. Originating from the Netherlands, ASML has positioned itself as a critical cog in the machinery of the digital age. With its unmatched ability to design and manufacture advanced lithography machines, ASML ensures the continuous shrinkage of microchips—a paramount necessity as the demand for faster, more efficient, and compact devices surges globally. The company’s bread and butter are its state-of-the-art Extreme Ultraviolet (EUV) lithography systems, which employ a complex interplay of light and lenses to etch extremely fine patterns onto silicon wafers. This technology is central to fabricating the most advanced semiconductors, found at the heart of every contemporary technology, from smartphones to supercomputers. ASML’s business model thrives on the integration of cutting-edge innovation and strategic partnerships. By collaborating closely with major chipmakers like Intel, Samsung, and TSMC, ASML ensures its technology not only meets but anticipates industry needs. The company generates revenue through the sale of these sophisticated machines, each potentially priced at over $100 million, complemented by lucrative long-term service agreements. In addition to selling new systems, ASML capitalizes on servicing and upgrading approximately 7,000 lithography machines operating worldwide. This approach provides a stable and continuous revenue stream, cementing ASML’s role as a linchpin in the semiconductor supply chain. Through relentless innovation and strategic maneuvers, ASML not only adapts to but shapes the future of technology.
See Also
What is ASML Holding NV's EPS (Diluted)?
EPS (Diluted)
24.7
EUR
Based on the financial report for Dec 31, 2025, ASML Holding NV's EPS (Diluted) amounts to 24.7 EUR.
What is ASML Holding NV's EPS (Diluted) growth rate?
EPS (Diluted) CAGR 10Y
23%
Over the last year, the EPS (Diluted) growth was 28%. The average annual EPS (Diluted) growth rates for ASML Holding NV have been 20% over the past three years , 24% over the past five years , and 23% over the past ten years .
