
Bubs Australia Ltd
ASX:BUB

Decide at what price you'd be comfortable buying and we'll help you stay ready.

|
Johnson & Johnson
NYSE:JNJ
|
US |

|
Berkshire Hathaway Inc
NYSE:BRK.A
|
US |

|
Bank of America Corp
NYSE:BAC
|
US |

|
Mastercard Inc
NYSE:MA
|
US |

|
UnitedHealth Group Inc
NYSE:UNH
|
US |

|
Exxon Mobil Corp
NYSE:XOM
|
US |

|
Pfizer Inc
NYSE:PFE
|
US |

|
Nike Inc
NYSE:NKE
|
US |

|
Visa Inc
NYSE:V
|
US |

|
Alibaba Group Holding Ltd
NYSE:BABA
|
CN |

|
JPMorgan Chase & Co
NYSE:JPM
|
US |

|
Coca-Cola Co
NYSE:KO
|
US |

|
Verizon Communications Inc
NYSE:VZ
|
US |

|
Chevron Corp
NYSE:CVX
|
US |

|
Walt Disney Co
NYSE:DIS
|
US |

|
PayPal Holdings Inc
NASDAQ:PYPL
|
US |
 Bubs Australia Ltd
Income from Continuing Operations
Bubs Australia Ltd
Income from Continuing Operations
Bubs Australia Ltd
Income from Continuing Operations Peer Comparison
Competitors Analysis
Latest Figures & CAGR of Competitors
| Company | Income from Continuing Operations | CAGR 3Y | CAGR 5Y | CAGR 10Y | ||
|---|---|---|---|---|---|---|
|
|
Bubs Australia Ltd
ASX:BUB
|
Income from Continuing Operations
AU$3.8m
|
CAGR 3-Years
N/A
|
CAGR 5-Years
N/A
|
CAGR 10-Years
N/A
|
|
|
Australian Agricultural Company Ltd
ASX:AAC
|
Income from Continuing Operations
AU$57.6m
|
CAGR 3-Years
-18%
|
CAGR 5-Years
6%
|
CAGR 10-Years
-2%
|
|
|
Bega Cheese Ltd
ASX:BGA
|
Income from Continuing Operations
AU$8.2m
|
CAGR 3-Years
33%
|
CAGR 5-Years
-25%
|
CAGR 10-Years
-9%
|
|
|
Ricegrowers Ltd
ASX:SGLLV
|
Income from Continuing Operations
AU$75.3m
|
CAGR 3-Years
13%
|
CAGR 5-Years
28%
|
CAGR 10-Years
4%
|
|
|
Inghams Group Ltd
ASX:ING
|
Income from Continuing Operations
AU$56.4m
|
CAGR 3-Years
59%
|
CAGR 5-Years
3%
|
CAGR 10-Years
N/A
|
|

|
Cobram Estate Olives Ltd
ASX:CBO
|
Income from Continuing Operations
AU$49.6m
|
CAGR 3-Years
N/A
|
CAGR 5-Years
N/A
|
CAGR 10-Years
N/A
|
|
Bubs Australia Ltd
Glance View
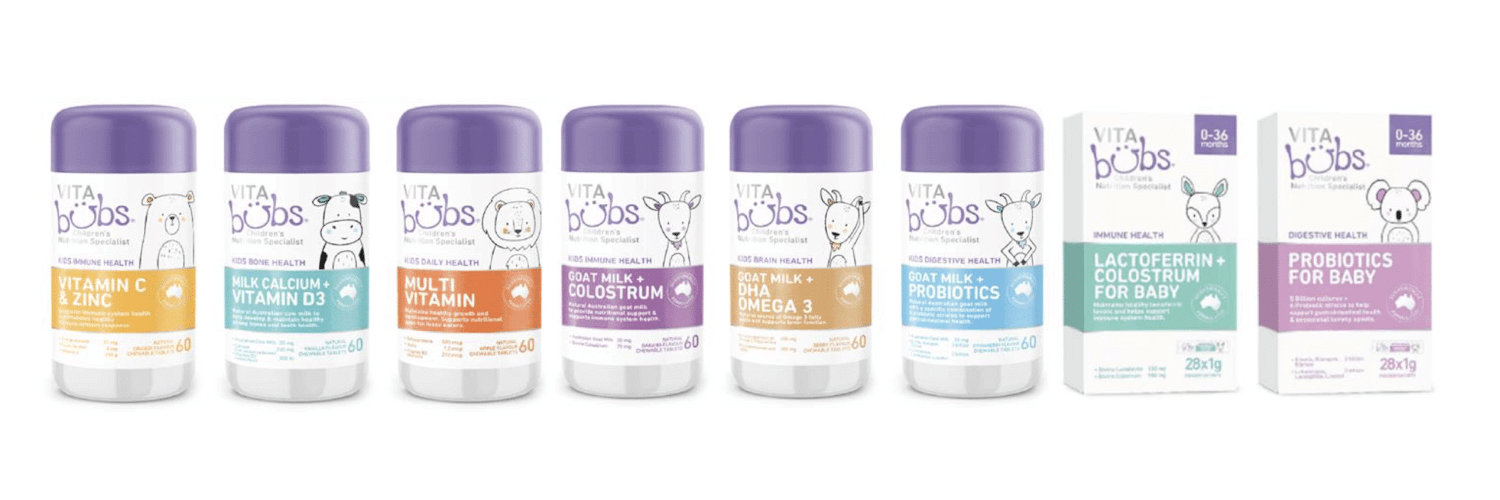
Bubs Australia Ltd. is a holding company, which offers organic baby food, goat milk infant formula and fresh dairy products. The company is headquartered in Frenchs Forest, New South Wales and currently employs 35 full-time employees. The firm produces goat dairy products and organic food products for all ages under the Bubs brand. Its products include cow’s milk formula, goats milk formula, organic baby food, cereals, toddler snacks, Vita Bubs, puree, rusks, infant and children's vitamin and mineral supplements. The company also offers children’s vitamin and mineral supplements that are also formulated with goat milk and address immune, bone, digestive and cognitive health concerns parents have for their children. The firm offers goat dairy products and produces goat milk-based formulae for adult everyday use, formulations, and adult immunity support for domestic and export markets. Its products are sold in supermarkets and pharmacies throughout Australia, as well as exported to China, Vietnam, Southeast Asia and the Middle East.
See Also
What is Bubs Australia Ltd's Income from Continuing Operations?
Income from Continuing Operations
3.8m
AUD
Based on the financial report for Dec 31, 2025, Bubs Australia Ltd's Income from Continuing Operations amounts to 3.8m AUD.
