
Castle Minerals Ltd
ASX:CDT
Castle Minerals Ltd
ASX:CDT
Price:
0.046
AUD
-4.17%
Market Closed
Market Cap:
AU$8m

Add Note
Add Target
Capture your thoughts and set a target
Decide at what price you'd be comfortable buying and we'll help you stay ready.
Based on
Margin of Safety
0%
10%
20%
30%
40%
50%
Your Price Target
Linked to
current price
· In Buy Zone
Loading
Note attached
Choose the stock you wish to monitor with a price target
Recently Viewed

|
Castle Minerals Ltd
ASX:CDT
|
AU |

|
Qube Holdings Ltd
ASX:QUB
|
AU |
|
M
|
Murray Cod Australia Ltd
ASX:MCA
|
AU |
|
T
|
Tiger Brands Ltd
JSE:TBS
|
ZA |

|
Scidev Ltd
ASX:SDV
|
AU |
|
G
|
Galaxia SM Inc
KRX:011420
|
KR |

|
Watkin Jones PLC
LSE:WJG
|
UK |

|
Mink Therapeutics Inc
NASDAQ:INKT
|
US |
|
B
|
Boilermech Holdings Bhd
KLSE:BOILERM
|
MY |
|
S
|
SIK Cheong Bhd
KLSE:SCB
|
MY |
|
S
|
Shopify Inc
LSE:0VHA
|
CA |
|
H
|
Human Creation Holdings Inc
TSE:7361
|
JP |

|
nLIGHT Inc
NASDAQ:LASR
|
US |
|
H
|
Haypp Group AB (publ)
STO:HAYPP
|
SE |

|
Hempacco Co Inc
OTC:HPCO
|
US |

|
Bank of The Ryukyus Ltd
TSE:8399
|
JP |

|
Blue Prism Group PLC
LSE:PRSM
|
UK |
|
P
|
Platina Resources Ltd
ASX:PGM
|
AU |
|
Caesarstone Ltd
NASDAQ:CSTE
|
IL |

|
Fagerhult AB
STO:FAG
|
SE |

|
Jones Lang LaSalle Inc
NYSE:JLL
|
US |

|
Fine-Line Circuits Ltd
BSE:517264
|
IN |

|
Eli Lilly and Co
NYSE:LLY
|
US |
|
A
|
Arecor Therapeutics PLC
LSE:AREC
|
UK |
Multiples-Based Value
The Multiples-Based Value of one
CDT
stock under the Base Case scenario is
hidden
AUD.
Compared to the current market price of 0.046 AUD,
Castle Minerals Ltd
is
hidden
.
Multiples-Based Value is the estimated value of a stock based on various valuation multiples like P/E and EV/EBIT ratios. It offers a quick snapshot of a stock's valuation in relation to its peers and historical norms.
Relative Valuation FAQ:
CDT Multiples-Based Value
LOCKED
Multiples Across Competitors
CDT Competitors Multiples
Castle Minerals Ltd Competitors
Castle Minerals Ltd Competitors
All Countries
| Market Cap | P/S | P/E | EV/EBITDA | EV/EBIT | ||||
|---|---|---|---|---|---|---|---|---|
| AU |
|
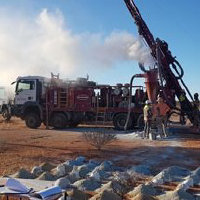
Castle Minerals Ltd
ASX:CDT
|
8m AUD | 1 092.7 | -2.2 | -1.5 | -1.5 | |
| RU |
P
|
Polyus PJSC
LSE:PLZL
|
70.4T USD | 11 233.1 | 34 959.7 | 19 286.2 | 22 132.2 | |
| ZA |
G
|
Gold Fields Ltd
JSE:GFI
|
638B ZAR | 4.5 | 11.1 | 6.8 | 8 | |
| ZA |
H
|
Harmony Gold Mining Company Ltd
JSE:HAR
|
153.8B ZAR | 1.9 | 9.4 | 4.7 | 5.7 | |
| CN |

|
Zijin Mining Group Co Ltd
SSE:601899
|
853.3B CNY | 2.5 | 16.6 | 12.3 | 12.3 | |
| US |

|
Newmont Corporation
NYSE:NEM
|
111.2B USD | 4.9 | 15.7 | 8.1 | 9.9 | |
| CA |

|
Agnico Eagle Mines Ltd
TSX:AEM
|
130B CAD | 8.2 | 21.9 | 12 | 15.1 | |
| AU |
G
|
Greatland Gold PLC
ASX:GGP
|
129B AUD | 39 | 105.5 | 67.2 | 75 | |
| CA |

|
Barrick Mining Corp
F:ABR0
|
54.6B EUR | 3.9 | 13.3 | 6.5 | 8 | |
| CA |

|
Barrick Gold Corp
TSX:ABX
|
87B CAD | 3.9 | 13.1 | 6.4 | 7.9 | |
| HK |
Z
|
Zijin Gold International Co Ltd
HKEX:2259
|
451B HKD | 10.7 | 36 | 17.4 | 20 |
P/S Multiple
P/E Multiple
EV/EBITDA Multiple
EV/EBIT Multiple
