Fisher & Paykel Healthcare Corporation Ltd
F:FPLB

Decide at what price you'd be comfortable buying and we'll help you stay ready.

|
Fisher & Paykel Healthcare Corporation Ltd
F:FPLB
|
NZ |

|
TBS Holdings Inc
OTC:TKOBF
|
JP |

|
Nuvo Pharmaceuticals Inc
TSX:MRV
|
CA |
|
I
|
Indosat Tbk PT
XMUN:IDO1
|
ID |
Wall St Price Targets
FPLB Price Targets Summary
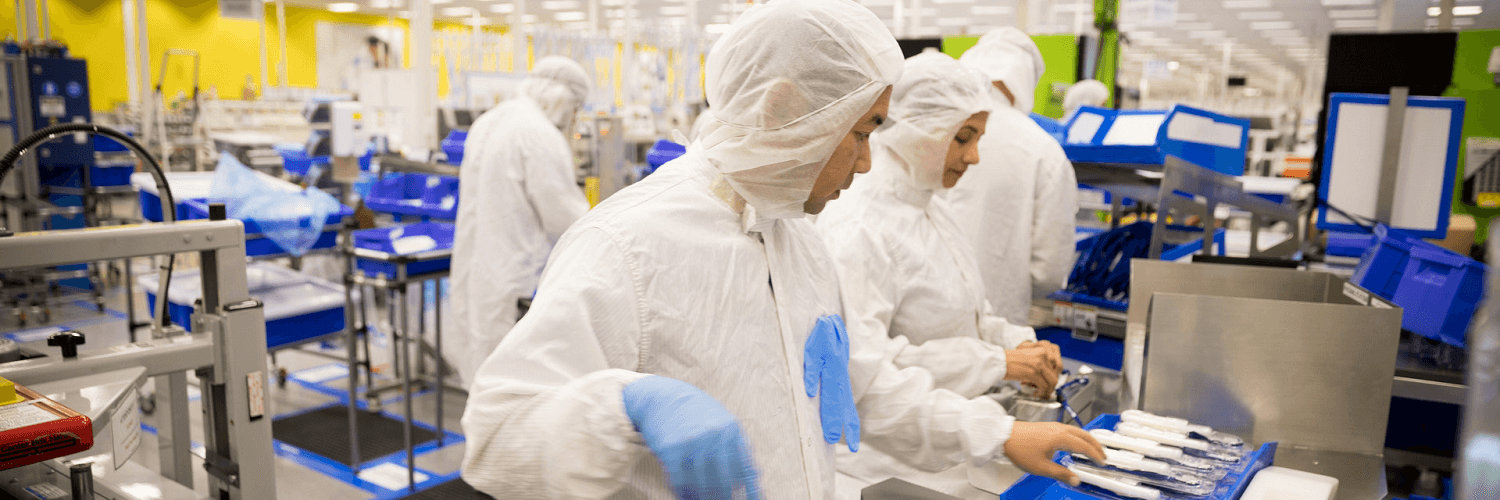
Fisher & Paykel Healthcare Corporation Ltd

According to Wall Street analysts, the average 1-year price target for FPLB is 18.63 EUR with a low forecast of 16.23 EUR and a high forecast of 22.03 EUR.
Our estimates are sourced from the pool of sell-side and buy-side analysts that we have access to. What you see on other sites is mostly sourced from sell-side analysts.
What is FPLB's stock price target?
Price Target
18.63
EUR
According to Wall Street analysts, the average 1-year price target for FPLB is 18.63 EUR with a low forecast of 16.23 EUR and a high forecast of 22.03 EUR.
What is the Revenue forecast for Fisher & Paykel Healthcare Corporation Ltd?
Projected CAGR
12%
Over the last 13 years, the compound annual growth rate for Revenue has been 11%. The projected CAGR for the next 3 years is 12%.
What is the Gross Profit forecast for Fisher & Paykel Healthcare Corporation Ltd?
Projected CAGR
14%
Over the last 13 years, the compound annual growth rate for Gross Profit has been 12%. The projected CAGR for the next 3 years is 14%.
What is the Operating Income forecast for Fisher & Paykel Healthcare Corporation Ltd?
Projected CAGR
19%
Over the last 13 years, the compound annual growth rate for Operating Income has been 14%. The projected CAGR for the next 3 years is 19%.
What is the Pre-Tax Income forecast for Fisher & Paykel Healthcare Corporation Ltd?
Projected CAGR
20%
Over the last 13 years, the compound annual growth rate for Pre-Tax Income has been 14%. The projected CAGR for the next 3 years is 20%.
What is the Net Income forecast for Fisher & Paykel Healthcare Corporation Ltd?
Projected CAGR
20%
Over the last 13 years, the compound annual growth rate for Net Income has been 15%. The projected CAGR for the next 3 years is 20%.
