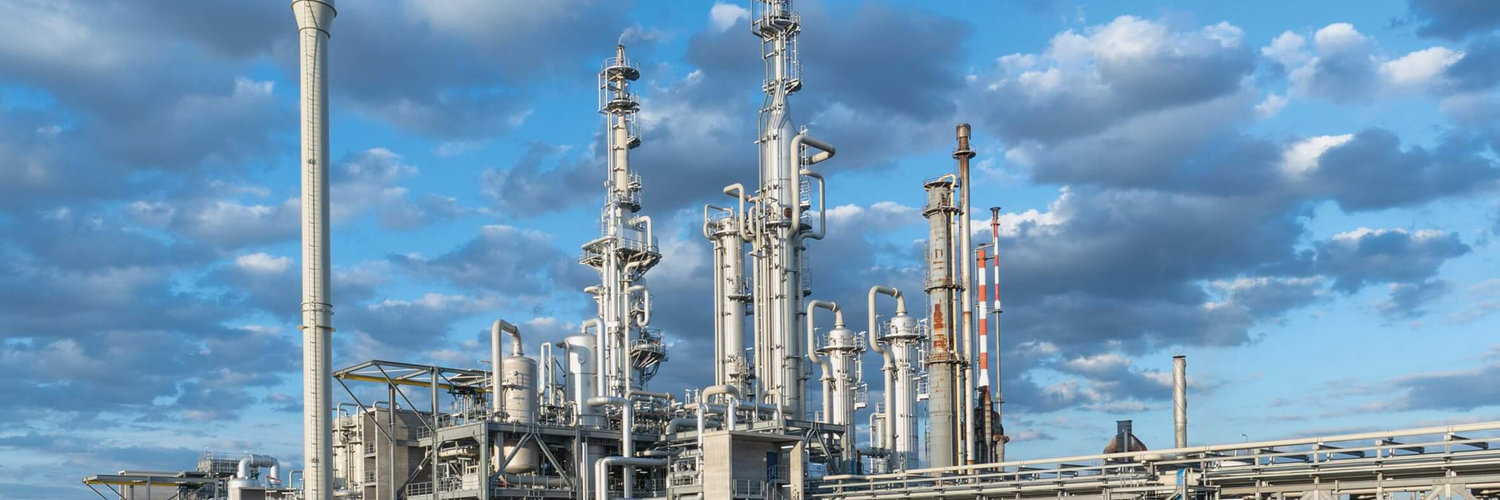

Basf Se
LSE:0BFA

Decide at what price you'd be comfortable buying and we'll help you stay ready.

|
Basf Se
LSE:0BFA
|
DE |

|
Tencent Music Entertainment Group
NYSE:TME
|
CN |
|
F
|
Flotek Industries Inc
F:F2I
|
US |
|
A
|
Alpha Services and Holdings SA
SWB:ACBB
|
GR |
|
B
|
Burberry Group PLC
DUS:BB2
|
UK |
|
S
|
Selective Insurance Group Inc
F:SV2
|
US |
|
Q
|
QBE Insurance Group Ltd
F:QBE
|
AU |

|
Newcap Holding A/S
F:25N
|
DK |

|
MindTree Ltd
NSE:MINDTREE
|
IN |
|
Tecan Group AG
OTC:TCHBF
|
CH |

|
DREAM Unlimited Corp
TSX:DRM
|
CA |

|
Triboo SpA
F:0T6
|
IT |
|
R
|
Rotork PLC
F:RO41
|
UK |

|
Guanajuato Silver Company Ltd
F:E35
|
CA |

|
Vulcan Energy Resources Ltd
ASX:VUL
|
AU |

|
Sigma Lithium Corp
XTSX:SGML
|
CA |
|
S
|
Spero Therapeutics Inc
F:2HA
|
US |
|
T
|
Teleperformance SE
XBER:RCF
|
FR |
|
T
|
Tertiary Minerals PLC
XBER:TMU
|
UK |
|
B
|
Bendigo and Adelaide Bank Ltd
F:BDJ
|
AU |

|
CVB Financial Corp
NASDAQ:CVBF
|
US |
|
C
|
Cognex Corp
F:CGZ
|
US |
Profitability Summary
Basf Se's profitability score is Hidden . We take all the information about a company's profitability, such as its margins, capital efficiency, free cash flow generating ability, and more, and consolidate it into one single number: the profitability score. The higher the profitability score, the more profitable the company is.
Profitability Score
We take all the information about a company's profitability, such as its margins, capital efficiency, free cash flow generating ability, and more, and consolidate it into one single number: the profitability score. The higher the profitability score, the more profitable the company is.
We take all the information about a company's profitability, such as its margins, capital efficiency, free cash flow generating ability, and more, and consolidate it into one single number: the profitability score. The higher the profitability score, the more profitable the company is.
Profitability Score

