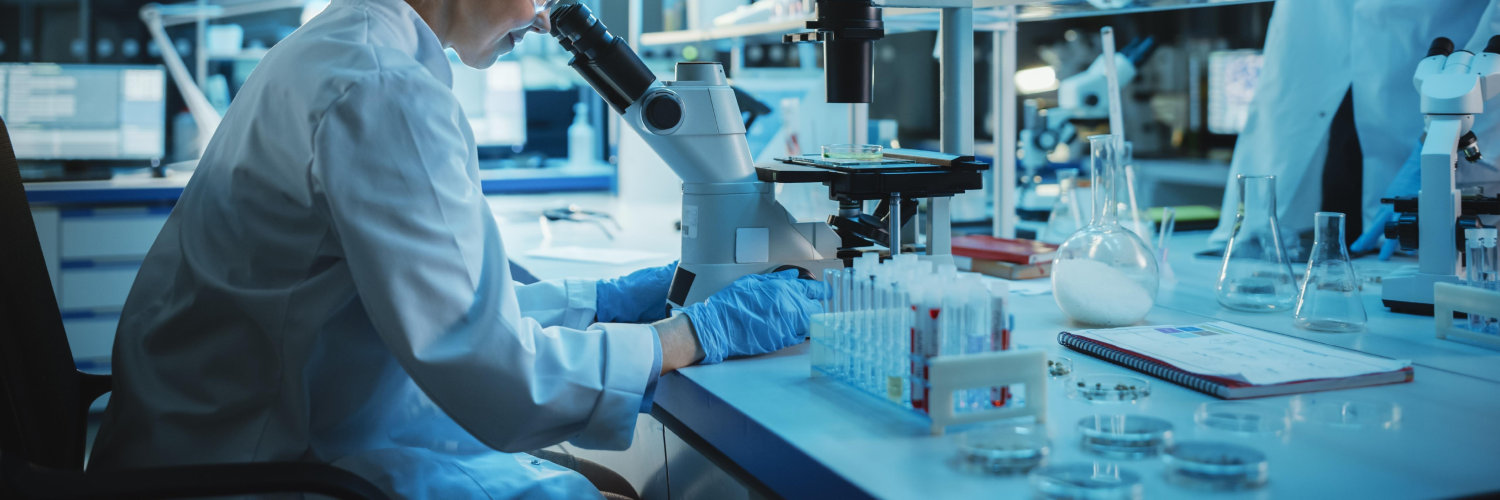

Sartorius Stedim Biotech SA
LSE:0RG8

Decide at what price you'd be comfortable buying and we'll help you stay ready.

|
Sartorius Stedim Biotech SA
LSE:0RG8
|
FR |

|
eGain Corp
NASDAQ:EGAN
|
US |
|
American Financial Group Inc
NYSE:AFG
|
US |
|
A
|
Ajinomoto Co Inc
SWB:AJI
|
JP |

|
Nicox SA
PAR:ALCOX
|
FR |

|
Riwi Corp
XTSX:RIWI
|
CA |

|
Schibsted ASA
OSE:SCHA
|
NO |
|
C
|
China Vered Financial Holding Corporation Ltd
HKEX:2451
|
HK |
|
Walchandnagar Industries Ltd
NSE:WALCHANNAG
|
IN |

|
Stockland Corporation Ltd
ASX:SGP
|
AU |
|
L
|
Lululemon Athletica Inc
LSE:0JVT
|
CA |
Dividends
Dividend Yield
Sartorius Stedim Biotech SA

| Current Yield | |
| Min Yield | |
| Max Yield | |
| Average Yield | |
| Median Yield |
Dividend Per Share
Sartorius Stedim Biotech SA
0RG8 have increased by 35%.
Payout Ratio
Sartorius Stedim Biotech SA
Peers Comparison
Dividends
Shareholder Yield
Current shareholder yield for 0RG8 is
hidden
.
Peers Comparison
Shareholder Yield
Buybacks
Buyback Yield measures how much a company reduces its outstanding shares through repurchases, expressed as a percentage.
This metric directly reflects the company’s efforts to return value to shareholders. By reducing the number of shares, buybacks can increase earnings per share and potentially boost the stock's price.

Peers Comparison
Buybacks
Debt Paydown
Debt Paydown Yield measures the amount of debt a company repays within a specific period, shown as a percentage of its market capitalization.
This metric indicates how the company is using its capital to decrease financial liabilities, which can strengthen its financial health and potentially enhance shareholder value.
Peers Comparison
Debt Paydown
Price Appreciation
0RG8 Price
Sartorius Stedim Biotech SA
| Average Annual Return | -14.22% |
| Standard Deviation of Annual Returns | 21.34% |
| Max Drawdown | -73% |
| Market Capitalization | 15.9B EUR |
| Shares Outstanding | 246 544 842 |
| Percentage of Shares Shorted |
N/A
|
0RG8 Return Decomposition
Main factors of price return
Stock Splits
0RG8's latest stock split occurred on May 6, 2016
The company executed a 6-for-1 stock split, meaning that for every share held, investors received 6 new shares.
Before the split, 0RG8 traded at 321.5 per share. Afterward, the share price was about 312.511.
The adjusted shares began trading on May 6, 2016. This was the only stock split in 0RG8's history.
