
Antofagasta PLC
LSE:ANTO

Decide at what price you'd be comfortable buying and we'll help you stay ready.

|
Johnson & Johnson
NYSE:JNJ
|
US |

|
Berkshire Hathaway Inc
NYSE:BRK.A
|
US |

|
Bank of America Corp
NYSE:BAC
|
US |

|
Mastercard Inc
NYSE:MA
|
US |

|
UnitedHealth Group Inc
NYSE:UNH
|
US |

|
Exxon Mobil Corp
NYSE:XOM
|
US |

|
Pfizer Inc
NYSE:PFE
|
US |

|
Nike Inc
NYSE:NKE
|
US |

|
Visa Inc
NYSE:V
|
US |

|
Alibaba Group Holding Ltd
NYSE:BABA
|
CN |

|
JPMorgan Chase & Co
NYSE:JPM
|
US |

|
Coca-Cola Co
NYSE:KO
|
US |

|
Verizon Communications Inc
NYSE:VZ
|
US |

|
Chevron Corp
NYSE:CVX
|
US |

|
Walt Disney Co
NYSE:DIS
|
US |

|
PayPal Holdings Inc
NASDAQ:PYPL
|
US |
 Antofagasta PLC
Operating Income
Antofagasta PLC
Operating Income
Antofagasta PLC
Operating Income Peer Comparison
Competitors Analysis
Latest Figures & CAGR of Competitors
| Company | Operating Income | CAGR 3Y | CAGR 5Y | CAGR 10Y | ||
|---|---|---|---|---|---|---|
|
|
Antofagasta PLC
LSE:ANTO
|
Operating Income
$3.4B
|
CAGR 3-Years
27%
|
CAGR 5-Years
16%
|
CAGR 10-Years
N/A
|
|

|
Central Asia Metals PLC
LSE:CAML
|
Operating Income
$72.4m
|
CAGR 3-Years
-11%
|
CAGR 5-Years
2%
|
CAGR 10-Years
11%
|
|
|
G
|
Great Southern Copper PLC
LSE:GSCU
|
Operating Income
-£1.9m
|
CAGR 3-Years
-31%
|
CAGR 5-Years
N/A
|
CAGR 10-Years
N/A
|
|
Antofagasta PLC
Glance View
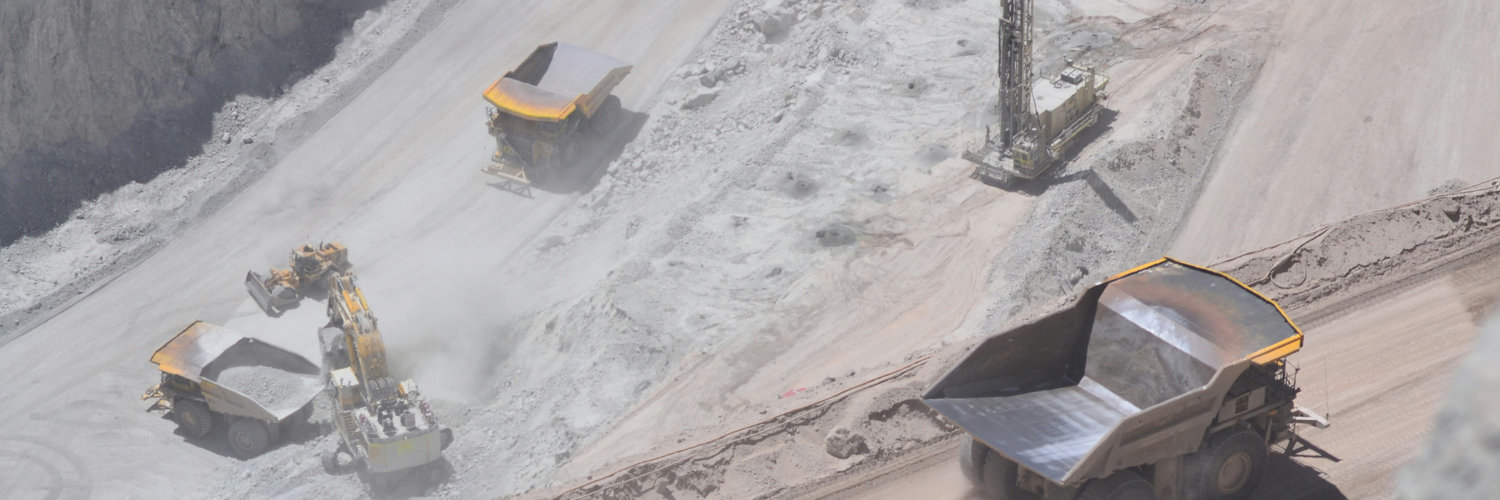
Antofagasta PLC, rooted in the mineral-rich landscapes of Chile, is a shining beacon in the world of mining, particularly through its commanding focus on copper. Established in the late 19th century, the company has evolved from its railway origins into a powerhouse within the copper industry, weaving its success around the global and incessant demand for this reddish-brown metal, crucial in electrical applications and construction. Mining is an intricate dance of extraction and refinement, and Antofagasta has mastered this, operating some of the most productive mines in the Andes Mountains, such as Los Pelambres. Here, the metal is carefully pried from the earth before undergoing a sophisticated process of crushing, grinding, and flotation to produce a concentrate that is then shipped across the world. What sets Antofagasta apart is not just its impressive portfolio of mines, but its strategic agility and balance in the face of the ever-fluctuating commodities market. The company's financial vitality is sustained by its ability to boost operational efficiencies and manage costs effectively, which are crucial in maintaining profitability when copper prices dip. Furthermore, Antofagasta diversifies its operations with interests in transportation and water distribution, leveraging its historical roots while supporting its core mining interest. This diversification strategy helps alleviate the oscillating nature typical of resource-based businesses, providing stability and a steady stream of revenues that flow concurrently with its primary copper operations. Through these concerted strategies and its entrenched commitment to sustainable practices, Antofagasta PLC has secured its status as a resilient player in the global mining industry.
See Also
What is Antofagasta PLC's Operating Income?
Operating Income
3.4B
USD
Based on the financial report for Dec 31, 2025, Antofagasta PLC's Operating Income amounts to 3.4B USD.
What is Antofagasta PLC's Operating Income growth rate?
Operating Income CAGR 5Y
16%
Over the last year, the Operating Income growth was 105%. The average annual Operating Income growth rates for Antofagasta PLC have been 27% over the past three years , 16% over the past five years .
