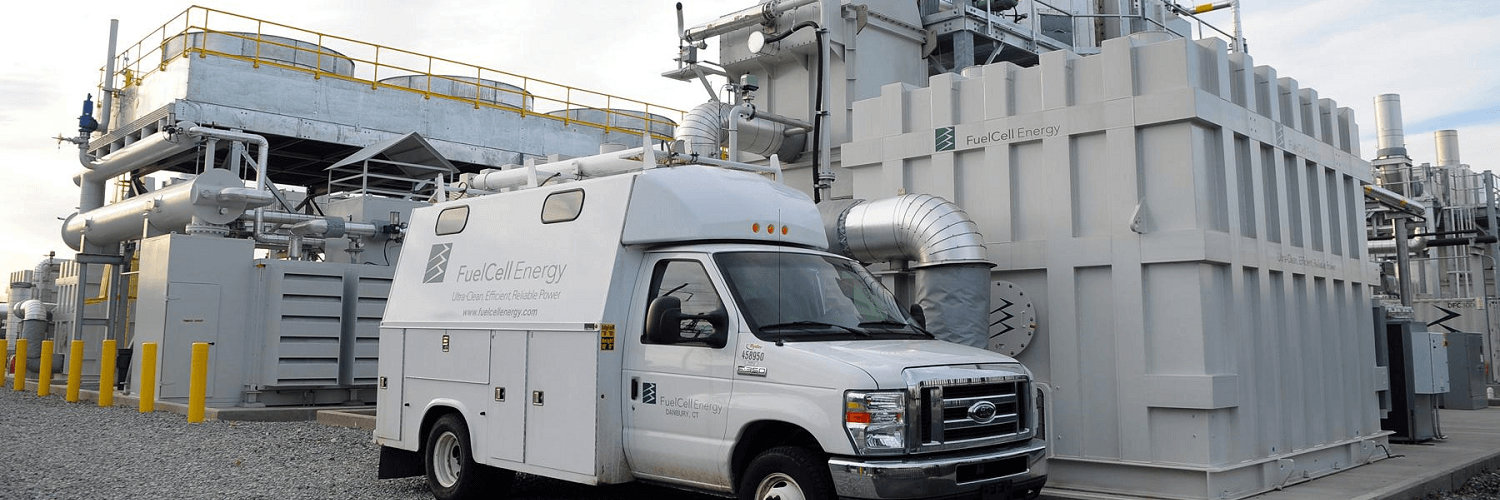

Fuelcell Energy Inc
NASDAQ:FCEL

Decide at what price you'd be comfortable buying and we'll help you stay ready.

|
Fuelcell Energy Inc
NASDAQ:FCEL
|
US |
|
C
|
Cummins Inc
DUS:CUM
|
US |
|
A
|
Azimut Holding SpA
DUS:HDB
|
IT |
|
T
|
Tapestry Inc
XMUN:COY
|
US |

|
Metso Outotec Corp
OTC:OUKPY
|
FI |

|
HAL Trust
AEX:HAL
|
MC |
|
C
|
Circa Group AS
OSE:CIRCA
|
NO |
|
W
|
Walmart Inc
F:WMT
|
US |
|
S
|
Supalai PCL
SET:SPALI
|
TH |

|
BlackBerry Ltd
TSX:BB
|
CA |
|
F
|
FirstGroup PLC
DUS:FGR
|
UK |
|
C
|
Cheesecake Factory Inc
DUS:CF2
|
US |

|
Sartorius AG
F:SRT3
|
DE |

|
Relief Therapeutics Holding SA
OTC:RLFTY
|
CH |
|
C
|
Coca Cola HBC AG
ATHEX:EEE
|
CH |
|
I
|
Interpublic Group of Companies Inc
XMUN:IPG
|
US |

|
Evertec Inc
F:2EV
|
PR |
|
D
|
Delivery Hero SE
DUS:DHER
|
DE |
|
F
|
Frey SA
F:943
|
FR |

|
Fujitsu Ltd
F:FUJA
|
JP |
Profitability Summary
Fuelcell Energy Inc's profitability score is Hidden . We take all the information about a company's profitability, such as its margins, capital efficiency, free cash flow generating ability, and more, and consolidate it into one single number: the profitability score. The higher the profitability score, the more profitable the company is.
Profitability Score
We take all the information about a company's profitability, such as its margins, capital efficiency, free cash flow generating ability, and more, and consolidate it into one single number: the profitability score. The higher the profitability score, the more profitable the company is.
We take all the information about a company's profitability, such as its margins, capital efficiency, free cash flow generating ability, and more, and consolidate it into one single number: the profitability score. The higher the profitability score, the more profitable the company is.
Profitability Score
