
Middleby Corp
NASDAQ:MIDD

Decide at what price you'd be comfortable buying and we'll help you stay ready.

|
Johnson & Johnson
NYSE:JNJ
|
US |

|
Berkshire Hathaway Inc
NYSE:BRK.A
|
US |

|
Bank of America Corp
NYSE:BAC
|
US |

|
Mastercard Inc
NYSE:MA
|
US |

|
UnitedHealth Group Inc
NYSE:UNH
|
US |

|
Exxon Mobil Corp
NYSE:XOM
|
US |

|
Pfizer Inc
NYSE:PFE
|
US |

|
Nike Inc
NYSE:NKE
|
US |

|
Visa Inc
NYSE:V
|
US |

|
Alibaba Group Holding Ltd
NYSE:BABA
|
CN |

|
JPMorgan Chase & Co
NYSE:JPM
|
US |

|
Coca-Cola Co
NYSE:KO
|
US |

|
Verizon Communications Inc
NYSE:VZ
|
US |

|
Chevron Corp
NYSE:CVX
|
US |

|
Walt Disney Co
NYSE:DIS
|
US |

|
PayPal Holdings Inc
NASDAQ:PYPL
|
US |
 Middleby Corp
Gross Profit
Middleby Corp
Gross Profit
Middleby Corp
Gross Profit Peer Comparison
Competitors Analysis
Latest Figures & CAGR of Competitors
| Company | Gross Profit | CAGR 3Y | CAGR 5Y | CAGR 10Y | ||
|---|---|---|---|---|---|---|
|
|
Middleby Corp
NASDAQ:MIDD
|
Gross Profit
$1.3B
|
CAGR 3-Years
-5%
|
CAGR 5-Years
7%
|
CAGR 10-Years
6%
|
|

|
Dover Corp
NYSE:DOV
|
Gross Profit
$3.3B
|
CAGR 3-Years
3%
|
CAGR 5-Years
5%
|
CAGR 10-Years
3%
|
|

|
Ingersoll Rand Inc
NYSE:IR
|
Gross Profit
$3.3B
|
CAGR 3-Years
13%
|
CAGR 5-Years
19%
|
CAGR 10-Years
N/A
|
|

|
Parker-Hannifin Corp
NYSE:PH
|
Gross Profit
$7.7B
|
CAGR 3-Years
13%
|
CAGR 5-Years
17%
|
CAGR 10-Years
11%
|
|

|
Barnes Group Inc
NYSE:B
|
Gross Profit
$8.7B
|
CAGR 3-Years
35%
|
CAGR 5-Years
11%
|
CAGR 10-Years
15%
|
|

|
Illinois Tool Works Inc
NYSE:ITW
|
Gross Profit
$7.1B
|
CAGR 3-Years
3%
|
CAGR 5-Years
6%
|
CAGR 10-Years
3%
|
|
Middleby Corp
Glance View
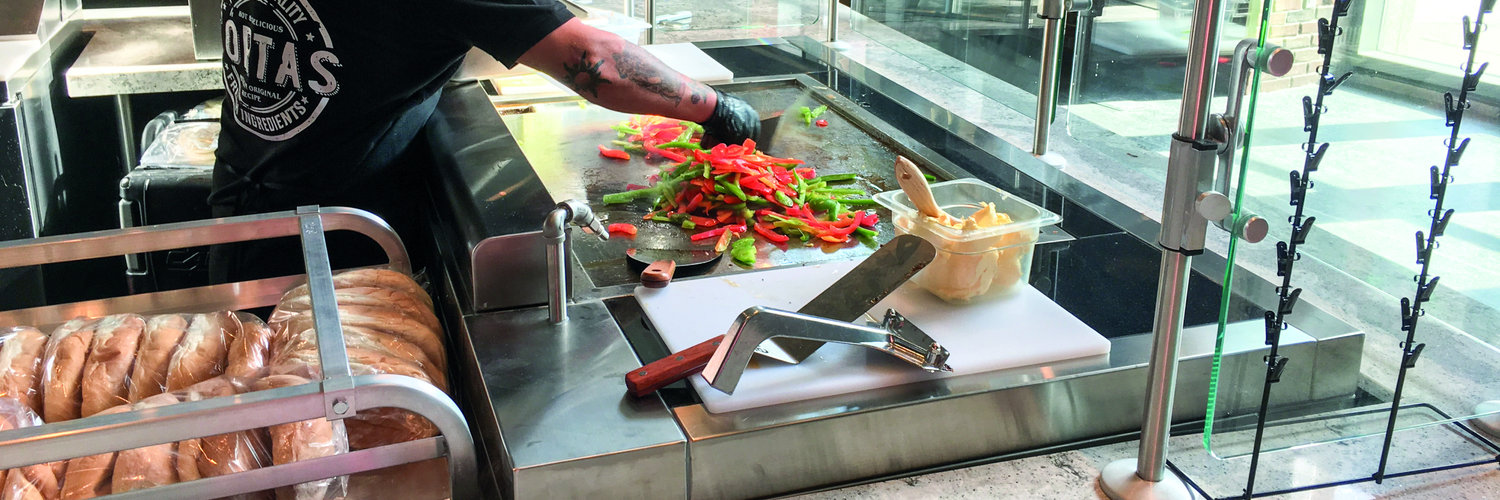
Middleby Corporation, nestled within the intricate mosaic of the global foodservice and processing landscape, has crafted a robust narrative defined by its innovative prowess and strategic acquisitions. Originating as a small enterprise in the 19th century, Middleby has grown into a formidable force, serving a diverse clientele that spans from restaurant chains to institutional foodservice providers. The company's success lies in its ability to meld tradition with technology, creating a portfolio of solutions that include cutting-edge commercial ovens, advanced cooking equipment, and comprehensive processing systems. Their focus is on enhancing efficiency and quality within the food production process, providing businesses with the tools to optimize their operations. This fusion of tradition and innovation allows Middleby to support its customers' quests for perfection in culinary endeavors. The revenue engine of Middleby is driven by its strategic positioning across three key segments: Commercial Foodservice, Food Processing, and Residential Kitchen Equipment. In Commercial Foodservice, Middleby capitalizes on its deep-seated relationships with restaurants and hospitality providers, offering an array of products that cater to efficiency-seeking chefs and operators. Meanwhile, the Food Processing segment serves a varied industrial base, delivering solutions that enhance food production, from bakery systems to meat processing. The Residential Kitchen Equipment segment, featuring premium home appliances, enables Middleby to tap into evolving consumer trends focused on high-quality culinary experiences at home. By orchestrating a symphony of technology, customer insight, and an aggressive acquisition strategy, Middleby has not only expanded its product offerings but also fortified its market reach, allowing it to sustain a diverse revenue stream and maintain its leadership in the foodservice equipment industry.
See Also
What is Middleby Corp's Gross Profit?
Gross Profit
1.3B
USD
Based on the financial report for Jan 3, 2026, Middleby Corp's Gross Profit amounts to 1.3B USD.
What is Middleby Corp's Gross Profit growth rate?
Gross Profit CAGR 10Y
6%
Over the last year, the Gross Profit growth was 0%. The average annual Gross Profit growth rates for Middleby Corp have been -5% over the past three years , 7% over the past five years , and 6% over the past ten years .
