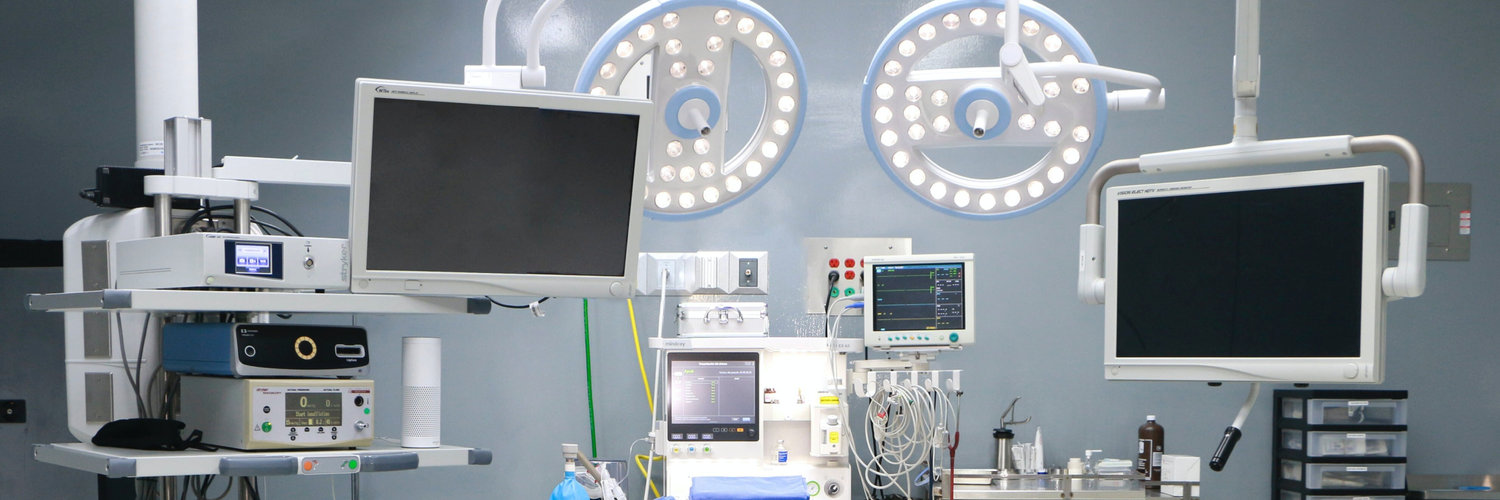

Transmedics Group Inc
NASDAQ:TMDX

Decide at what price you'd be comfortable buying and we'll help you stay ready.

|
Transmedics Group Inc
NASDAQ:TMDX
|
US |
|
B
|
Beacon Minerals Ltd
ASX:BCN
|
AU |

|
Peach Property Group AG
SIX:PEAN
|
CH |

|
Suncity Group Holdings Ltd
HKEX:1383
|
CN |

|
Synectics PLC
LSE:SNX
|
UK |

|
Paccar Inc
NASDAQ:PCAR
|
US |

|
Dollar Industries Ltd
NSE:DOLLAR
|
IN |

|
Sinopharm Group Co Ltd
HKEX:1099
|
CN |

|
Mitsui E&S Holdings Co Ltd
TSE:7003
|
JP |

|
Xamble Group Ltd
ASX:XGL
|
MY |
|
A
|
Advanced Holdings Ltd
SGX:BLZ
|
SG |
|
A
|
Applied Blockchain Inc
NASDAQ:APLD
|
US |

|
Afentra PLC
LSE:AET
|
UK |

|
Minotaur Exploration Ltd
ASX:MEP
|
AU |

|
Centamin PLC
LSE:CEY
|
JE |
Wall Street
Price Targets
TMDX Price Targets Summary
Transmedics Group Inc
According to Wall Street analysts, the average 1-year price target for
TMDX
is 164.498 USD
with a low forecast of 131.3 USD and a high forecast of 199.5 USD.
Our estimates are sourced from the pool of sell-side and buy-side analysts that we have access to. What is available on other sites you are seeing are mostly from the sell-side analysts.
What is TMDX's stock price target?
Price Target
164.498
USD
According to Wall Street analysts, the average 1-year price target for
TMDX
is 164.498 USD
with a low forecast of 131.3 USD and a high forecast of 199.5 USD.
What is Transmedics Group Inc's Revenue forecast?
Projected CAGR
20%
For the last 8 years the
compound annual growth rate for
Transmedics Group Inc's revenue is
73%.
The projected
CAGR
for the next 3 years is
20%.
What is Transmedics Group Inc's Operating Income forecast?
Projected CAGR
32%
The
compound annual growth rate
of Transmedics Group Inc's operating income for the next 3 years is
32%.
What is Transmedics Group Inc's Net Income forecast?
Projected CAGR
-6%
The
compound annual growth rate
of Transmedics Group Inc's net income for the next 3 years is
-6%.
