Village Farms International Inc
NASDAQ:VFF
Village Farms International Inc
NASDAQ:VFF
Price:
2.65
USD
-1.12%
Market Closed
Market Cap:
$305m

Add Note
Add Target
Capture your thoughts and set a target
Decide at what price you'd be comfortable buying and we'll help you stay ready.
Based on
Margin of Safety
0%
10%
20%
30%
40%
50%
Your Price Target
Linked to
current price
· In Buy Zone
Loading
Note attached
Choose the stock you wish to monitor with a price target
Recently Viewed
|
V
|
Village Farms International Inc
NASDAQ:VFF
|
CA |

|
Lifestance Health Group Inc
NASDAQ:LFST
|
US |
|
F
|
Forth Smart Service PCL
SET:FSMART
|
TH |
|
H
|
Healthlead PCL
SET:HL
|
TH |
|
A
|
Absolute Clean Energy PCL
SET:ACE
|
TH |
|
I
|
iStar Inc
F:OLZ
|
US |

|
Allbirds Inc
NASDAQ:BIRD
|
US |
|
N
|
Nikkiso Co Ltd
XMUN:NKO
|
JP |

|
Falmaco Nonwoven Industri Tbk PT
IDX:FLMC
|
ID |

|
Coeur Mining, Inc
TSX:CDE
|
US |

|
NP Korporatsiya Irkut PAO
MOEX:IRKT
|
RU |
Fundamental Analysis
Financials
Revenue & Expenses Breakdown
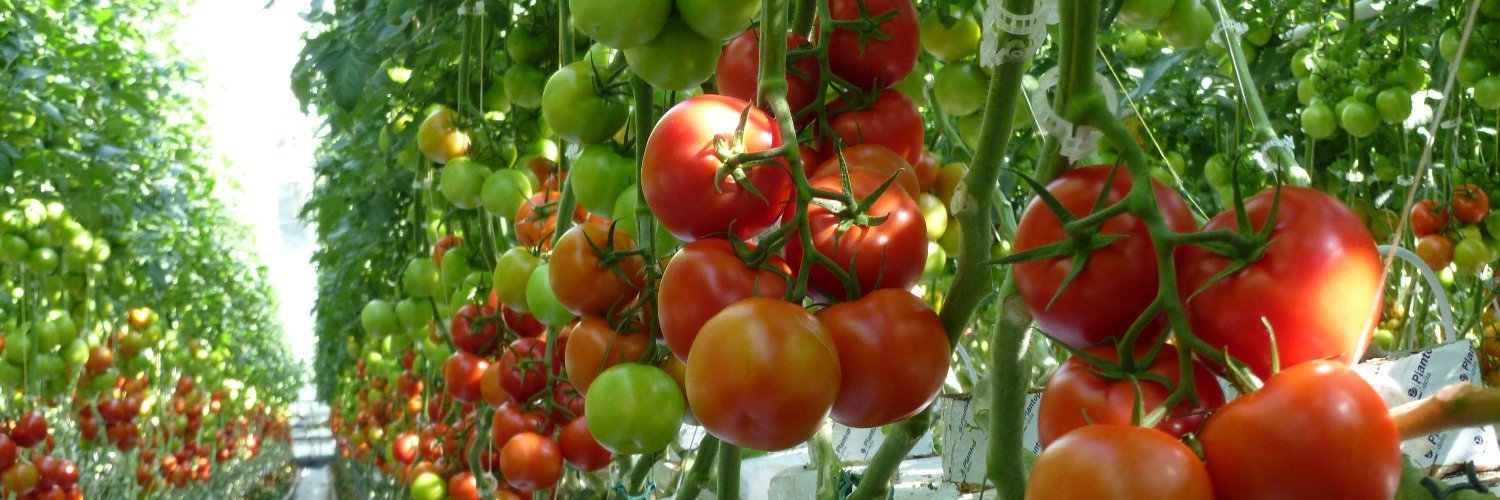
Village Farms International Inc

Village Farms International Inc
Efficiency
Earnings Waterfall
Village Farms International Inc
Village Farms International Inc

