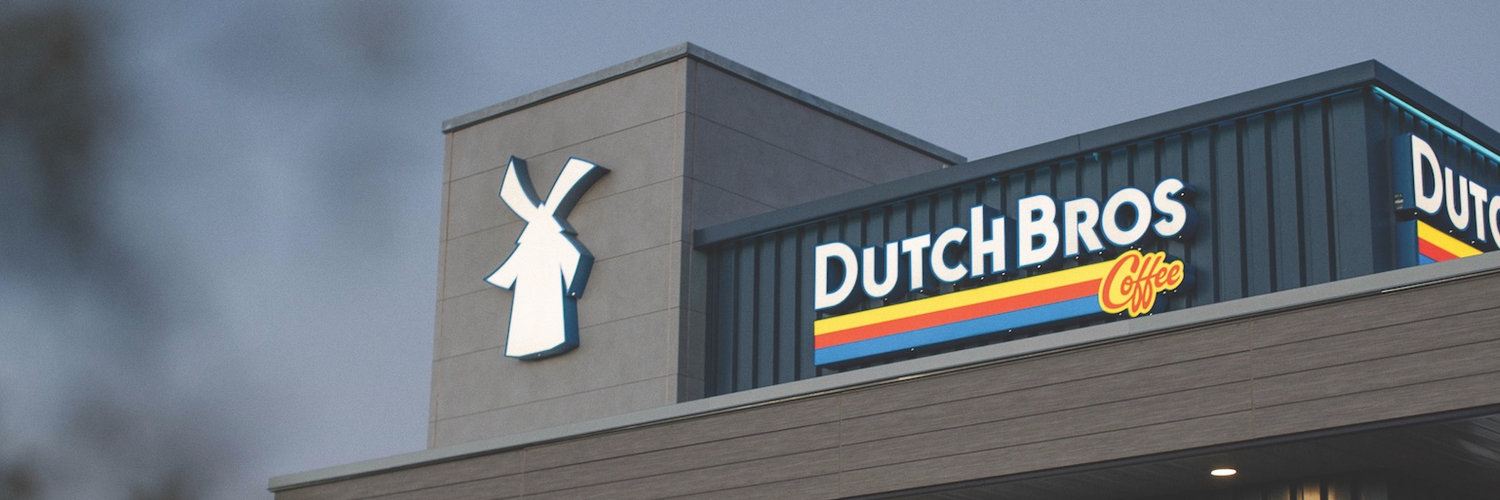

Dutch Bros Inc
NYSE:BROS

Decide at what price you'd be comfortable buying and we'll help you stay ready.

|
Dutch Bros Inc
NYSE:BROS
|
US |

|
SM Investments Corp
OTC:SVTMF
|
PH |

|
Burckhardt Compression Holding AG
F:B5H
|
CH |

|
Ferrovial SE
NASDAQ:FER
|
NL |
|
S
|
Sopra Steria Group SA
OTC:SPSAF
|
FR |

|
Cuscal Ltd
F:Y49
|
AU |
|
M
|
Mitsubishi Corp
OTC:MSBHF
|
JP |

|
First Solar Inc
LSE:0R06
|
US |

|
C&C Group PLC
LSE:CCR
|
IE |
|
D
|
Discover Financial Services
XBER:DC7
|
US |

|
Fulton Financial Corp
NASDAQ:FULT
|
US |
|
Casio Computer Co Ltd
TSE:6952
|
JP |

|
Abercrombie & Fitch Co
NYSE:ANF
|
US |
|
N
|
Nabati Foods Global Inc
F:7UW
|
CA |

|
Hyosung Heavy Industries Corp
KRX:298040
|
KR |

|
Aus Tin Mining Ltd
ASX:ANW
|
AU |

|
Zurn Water Solutions Corp
NYSE:ZWS
|
US |

|
Richter Gedeon Vegyeszeti Gyar Nyrt
OTC:GEDSF
|
HU |

|
HomeServe PLC
LSE:HSV
|
UK |
|
L
|
Lithium Ionic Corp
OTC:LTHCF
|
CA |
Wall St Price Targets
BROS Price Targets Summary
Dutch Bros Inc
According to Wall Street analysts, the average 1-year price target for BROS is 78.82 USD with a low forecast of 66.66 USD and a high forecast of 94.5 USD.
Price Targets


Our estimates are sourced from the pool of sell-side and buy-side analysts that we have access to. What you see on other sites is mostly sourced from sell-side analysts.
What is BROS's stock price target?
Price Target
78.82
USD
According to Wall Street analysts, the average 1-year price target for BROS is 78.82 USD with a low forecast of 66.66 USD and a high forecast of 94.5 USD.
What is the Revenue forecast for Dutch Bros Inc?
Projected CAGR
19%
Over the last 5 years, the compound annual growth rate for Revenue has been 38%. The projected CAGR for the next 8 years is 19%.
What is the Gross Profit forecast for Dutch Bros Inc?
Projected CAGR
19%
Over the last 5 years, the compound annual growth rate for Gross Profit has been 33%. The projected CAGR for the next 8 years is 19%.
What is the Operating Income forecast for Dutch Bros Inc?
Projected CAGR
24%
Over the last 5 years, the compound annual growth rate for Operating Income has been 73%. The projected CAGR for the next 8 years is 24%.
What is the Pre-Tax Income forecast for Dutch Bros Inc?
Projected CAGR
34%
Over the last 5 years, the compound annual growth rate for Pre-Tax Income has been 81%. The projected CAGR for the next 3 years is 34%.
What is the Net Income forecast for Dutch Bros Inc?
Projected CAGR
31%
The compound annual growth rate for Net Income over the next 8 years is 31%.
