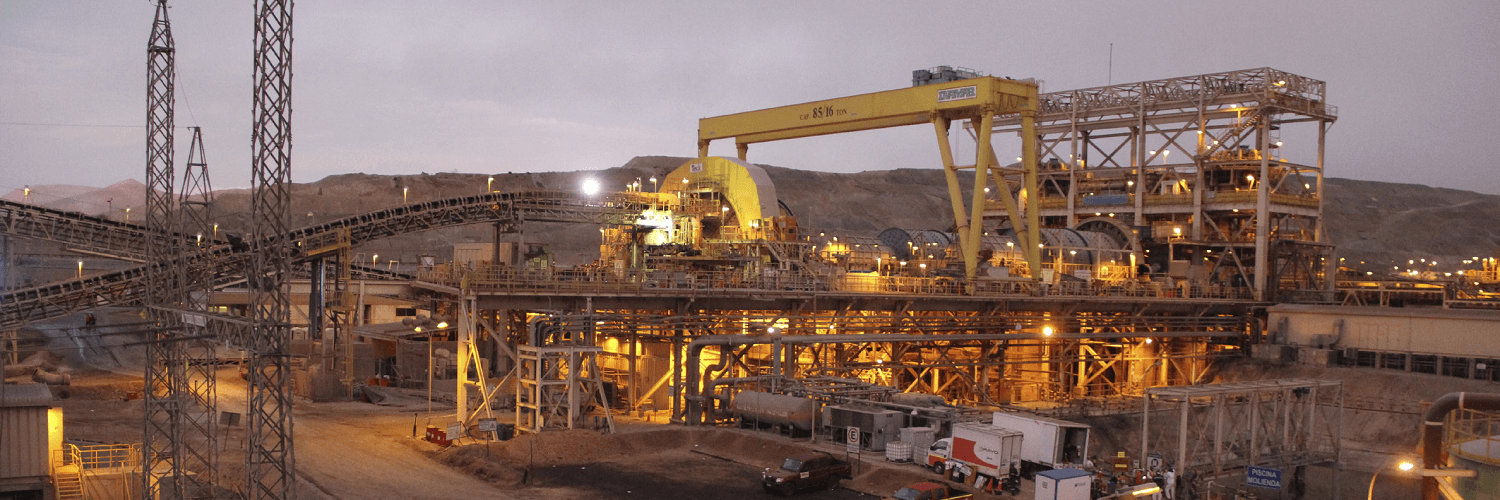
Teck Resources Ltd
NYSE:TECK

Watchlist Manager
Teck Resources Ltd Logo
Teck Resources Ltd
NYSE:TECK
Watchlist
Price: 45.25 USD 0.82% Market Closed
Market Cap: 22.1B USD

Intrinsic Value

The intrinsic value of one TECK stock under the Base Case scenario is 42.17 USD. Compared to the current market price of 45.25 USD, Teck Resources Ltd is Overvalued by 7%.

The Intrinsic Value is calculated as the average of DCF and Relative values:

TECK Intrinsic Value
42.17 USD
Overvaluation 7%
Intrinsic Value
Price
Worst Case
Base Case
Best Case

Valuation History
Teck Resources Ltd

What is Valuation History?
Ask AI Assistant
What other research platforms think about TECK?

Let our AI compare Alpha Spread’s intrinsic value with external valuations from Simply Wall St, GuruFocus, ValueInvesting.io, Seeking Alpha, and others.

Discover External Valuations
Why is TECK valued this way?

Let our AI break down the key assumptions behind the intrinsic value calculation for Teck Resources Ltd.

Explain Valuation
Compare TECK to

Fundamental Analysis

Company Overview
Loading...
Business Segments
Loading...
Economic Moat
Loading...
Earnings Call
Loading...
Management
Loading...
Contacts
Loading...
Bear Theses

Teck’s heavy exposure to steelmaking coal, which remains its largest revenue driver, makes it vulnerable to any downturn in global steel production or changes in Chinese import policies. Prolonged weakness in metallurgical coal prices could meaningfully erode profit margins and free cash flow.

Large-scale capital investments in copper growth projects, especially QB2 in Chile, carry significant execution risks. Any cost overruns, permitting delays, or political headwinds—such as higher Chilean mining taxes—could strain the balance sheet and reduce investor confidence in Teck’s diversification plans.

Evolving environmental, social, and governance (ESG) standards, including stricter carbon emissions regulations in Canada, could raise operational costs at Teck’s mines. Mounting reclamation liabilities and negative community relations at project sites may further pressure future development and profitability.

Bull Theses

Teck’s strategic push into copper, driven by surging demand from electric vehicle and renewable energy markets, could help reduce reliance on coal and position the company as a leader in metals critical for the energy transition.

Management has taken steps to strengthen the balance sheet through disciplined spending and targeted divestments, leaving Teck with improved liquidity and flexibility to pursue high-return expansion projects—even amid market volatility.

Teck’s metallurgical coal operations in the Elk Valley benefit from extensive reserves and relatively low production costs, allowing the firm to capture strong margins even at moderate price levels and fund strategic initiatives in other segments.

Show More Less
How do you feel about TECK?
Bearish
Neutral
Bullish
Financials
Annual
Quarterly
TTM
Annual
Quarterly
TTM

Balance Sheet Decomposition
Teck Resources Ltd

Current Assets 10.5B
Cash & Short-Term Investments 4.8B
Receivables 2.6B
Other Current Assets 3.1B
Non-Current Assets 34B
Long-Term Investments 2.2B
PP&E 29.7B
Intangibles 606m
Other Non-Current Assets 1.6B
Current Liabilities 3.8B
Accounts Payable 2.9B
Other Current Liabilities 909m
Non-Current Liabilities 15.8B
Long-Term Debt 9.1B
Other Non-Current Liabilities 6.8B
Efficiency

Free Cash Flow Analysis
Teck Resources Ltd

Last Value
3-Years Average
FCF Margin
Conversion Rate

Earnings Waterfall
Teck Resources Ltd

Revenue
10.5B CAD
Cost of Revenue
-8.3B CAD
Gross Profit
2.2B CAD
Operating Expenses
-720m CAD
Operating Income
1.5B CAD
Other Expenses
-233m CAD
Net Income
1.3B CAD
Fundamental Scores

TECK Profitability Score
Profitability Due Diligence

Teck Resources Ltd's profitability score is 44/100. The higher the profitability score, the more profitable the company is.

Sustainable 3Y Average Operating Margin
Sustainable 3Y Average Gross Margin
Healthy Operating Margin
Healthy Gross Margin
44/100
Profitability
Score

Teck Resources Ltd's profitability score is 44/100. The higher the profitability score, the more profitable the company is.

TECK Solvency Score
Solvency Due Diligence

Teck Resources Ltd's solvency score is 48/100. The higher the solvency score, the more solvent the company is.

Low D/E
Short-Term Solvency
Long-Term Solvency
Positive Net Debt
48/100
Solvency
Score

Teck Resources Ltd's solvency score is 48/100. The higher the solvency score, the more solvent the company is.

Wall St
Price Targets

TECK Price Targets Summary
Teck Resources Ltd

Wall Street analysts forecast TECK stock price to rise over the next 12 months.

According to Wall Street analysts, the average 1-year price target for TECK is 64.05 USD with a low forecast of 57.08 USD and a high forecast of 73.5 USD.

Lowest
Price Target
57.08 USD
26% Upside
Average
Price Target
64.05 USD
42% Upside
Highest
Price Target
73.5 USD
62% Upside
View Analyst Estimates

Dividends

Dividend Yield
Lowest
Average
Highest
Dividend Per Share
N/A
Growth 3Y
Growth 5Y
Growth 10Y
Dividend Safety Score
Very
Unsafe
Unsafe
Safe
Very
Safe
0
25
50
75
100
Previous Payment
-
Today
Next Payment
-
Today
Dec 6, 2025
Previous Payment
-
Next Payment
-
Ex-Dividend Date
-
Shareholder Yield

Current shareholder yield for TECK is .

Shareholder yield represents the total return a company provides to its shareholders, calculated as the sum of dividend yield, buyback yield, and debt paydown yield. What is shareholder yield?

Shareholder Yield
Dividend Yield
Lowest
Average
Highest
Buyback Yield
Lowest
Average
Highest
Debt Paydown Yield
Lowest
Average
Highest

Competitive Landscape

Company Market Cap Intrinsic Valuation Profitability Solvency Price Change
1Y 3Y 5Y

TECK News

Other Videos
What is the Intrinsic Value of one TECK stock?

The intrinsic value of one TECK stock under the Base Case scenario is 42.17 USD.

Is TECK stock undervalued or overvalued?

Compared to the current market price of 45.25 USD, Teck Resources Ltd is Overvalued by 7%.

Back to Top