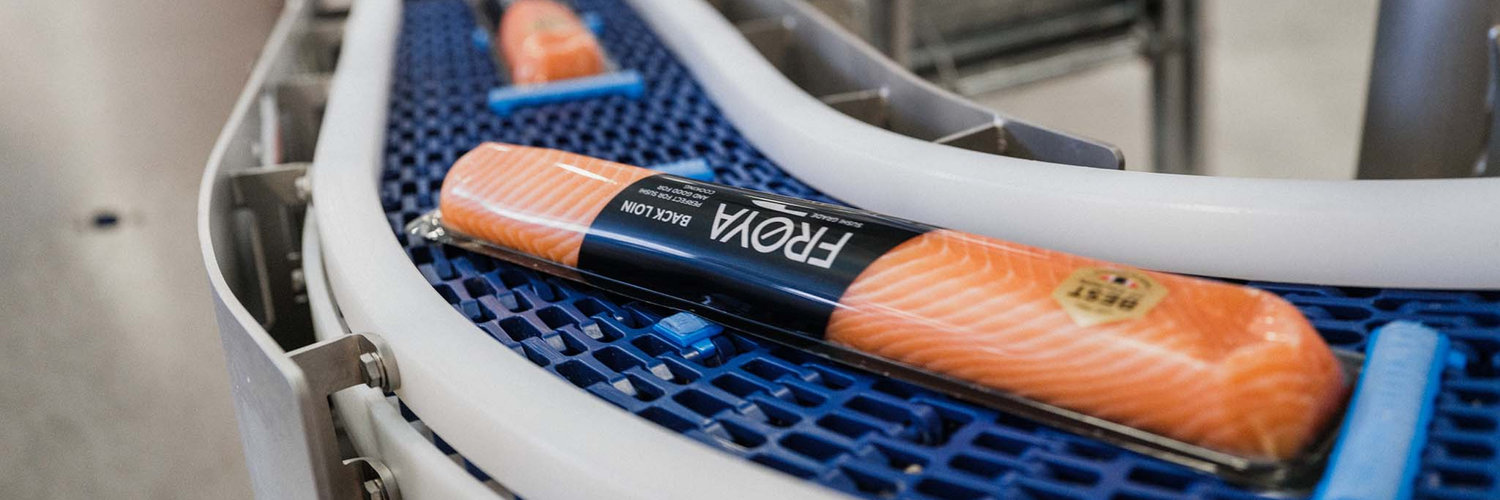

SalMar ASA
OSE:SALM

Decide at what price you'd be comfortable buying and we'll help you stay ready.

|
SalMar ASA
OSE:SALM
|
NO |
|
Insurance Australia Group Ltd
ASX:IAG
|
AU |

|
Esperion Therapeutics Inc
NASDAQ:ESPR
|
US |
|
F
|
Franklin Electric Co Inc
F:FE4
|
US |

|
Artivion Inc
NYSE:AORT
|
US |
|
S
|
SIS Distribution Thailand PCL
SET:SIS
|
TH |
|
F
|
Flexopack SA
ATHEX:FLEXO
|
GR |
|
I
|
Itron Inc
F:IT6
|
US |

|
Elys Game Technology Corp
F:3UW
|
CA |

|
Tata Technologies Ltd
NSE:TATATECH
|
IN |
|
F
|
Fidelix Co Ltd
KOSDAQ:032580
|
KR |

|
Catalyst Pharmaceuticals Inc
NASDAQ:CPRX
|
US |
Wall Street
Price Targets
SALM Price Targets Summary
SalMar ASA
According to Wall Street analysts, the average 1-year price target for
SALM
is 627.86 NOK
with a low forecast of 505 NOK and a high forecast of 714 NOK.
Price Targets
Our estimates are sourced from the pool of sell-side and buy-side analysts that we have access to. What is available on other sites you are seeing are mostly from the sell-side analysts.
What is SALM's stock price target?
Price Target
627.86
NOK
According to Wall Street analysts, the average 1-year price target for
SALM
is 627.86 NOK
with a low forecast of 505 NOK and a high forecast of 714 NOK.
What is SalMar ASA's Revenue forecast?
Projected CAGR
12%
For the last 14 years the
compound annual growth rate for
SalMar ASA's revenue is
15%.
The projected
CAGR
for the next 3 years is
12%.
What is SalMar ASA's Operating Income forecast?
Projected CAGR
53%
For the last 14 years the
compound annual growth rate for
SalMar ASA's operating income is
19%.
The projected
CAGR
for the next 3 years is
53%.
What is SalMar ASA's Net Income forecast?
Projected CAGR
80%
For the last 14 years the
compound annual growth rate for
SalMar ASA's net income is
16%.
The projected
CAGR
for the next 3 years is
80%.
