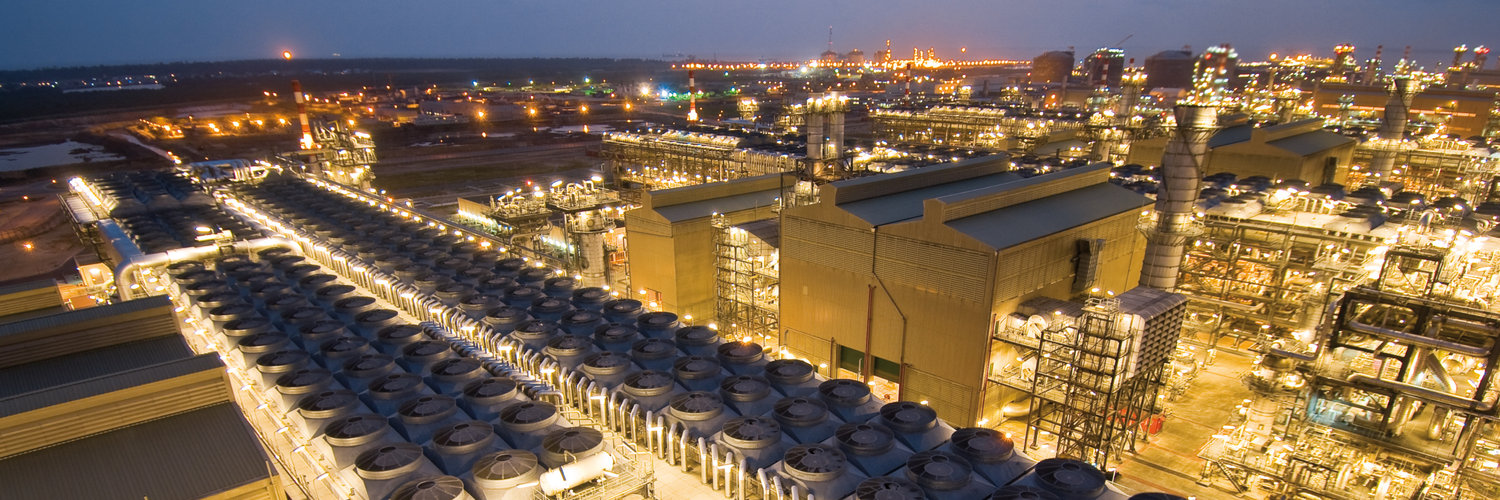
Saipem SpA banner

Saipem SpA
OTC:SAPMF

Watchlist Manager
Saipem SpA Logo
Saipem SpA
OTC:SAPMF
Watchlist
Price: 4.02 USD -6.51% Market Closed
Market Cap: $7.9B

Profitability Summary

Saipem SpA's profitability score is hidden . We take all the information about a company's profitability (such as its margins, capital efficiency, free cash flow generating ability, and more) and consolidate it into one single number - the profitability score. The higher the profitability score, the more profitable the company is.

Sign Up to see
Profitability Score
Sign In
Sign Up

We take all the information about a company's profitability (such as its margins, capital efficiency, free cash flow generating ability, and more) and consolidate it into one single number - the profitability score. The higher the profitability score, the more profitable the company is.

We take all the information about a company's profitability (such as its margins, capital efficiency, free cash flow generating ability, and more) and consolidate it into one single number - the profitability score. The higher the profitability score, the more profitable the company is.

Sign Up to see
Profitability Score
Sign In
Sign Up

Margins

Earnings Waterfall
Saipem SpA

Margins Comparison
Saipem SpA Competitors

Country Company Market Cap Gross
Margin
Operating
Margin
Net
Margin
IT
Saipem SpA
MIL:SPM
6.3B EUR
Loading...
Loading...
Loading...
US
Schlumberger NV
NYSE:SLB
72.2B USD
Loading...
Loading...
Loading...
US
Baker Hughes Co
NASDAQ:BKR
61.4B USD
Loading...
Loading...
Loading...
US
Halliburton Co
NYSE:HAL
29.1B USD
Loading...
Loading...
Loading...
LU
Tenaris SA
MIL:TEN
23.8B EUR
Loading...
Loading...
Loading...
UK
TechnipFMC PLC
NYSE:FTI
26.5B USD
Loading...
Loading...
Loading...
CN
Yantai Jereh Oilfield Services Group Co Ltd
SZSE:002353
128B CNY
Loading...
Loading...
Loading...
CN
Sinopec Oilfield Service Corp
SSE:600871
73.6B CNY
Loading...
Loading...
Loading...
CN
CNOOC Energy Technology & Services Ltd
SSE:600968
56.3B CNY
Loading...
Loading...
Loading...
UK
Subsea 7 SA
OSE:SUBC
72.2B NOK
Loading...
Loading...
Loading...
US
Nov Inc
NYSE:NOV
7.1B USD
Loading...
Loading...
Loading...

Return on Capital

Return on Capital Comparison
Saipem SpA Competitors

Country Company Market Cap ROE ROA ROCE ROIC
IT
Saipem SpA
MIL:SPM
6.3B EUR
Loading...
Loading...
Loading...
Loading...
US
Schlumberger NV
NYSE:SLB
72.2B USD
Loading...
Loading...
Loading...
Loading...
US
Baker Hughes Co
NASDAQ:BKR
61.4B USD
Loading...
Loading...
Loading...
Loading...
US
Halliburton Co
NYSE:HAL
29.1B USD
Loading...
Loading...
Loading...
Loading...
LU
Tenaris SA
MIL:TEN
23.8B EUR
Loading...
Loading...
Loading...
Loading...
UK
TechnipFMC PLC
NYSE:FTI
26.5B USD
Loading...
Loading...
Loading...
Loading...
CN
Yantai Jereh Oilfield Services Group Co Ltd
SZSE:002353
128B CNY
Loading...
Loading...
Loading...
Loading...
CN
Sinopec Oilfield Service Corp
SSE:600871
73.6B CNY
Loading...
Loading...
Loading...
Loading...
CN
CNOOC Energy Technology & Services Ltd
SSE:600968
56.3B CNY
Loading...
Loading...
Loading...
Loading...
UK
Subsea 7 SA
OSE:SUBC
72.2B NOK
Loading...
Loading...
Loading...
Loading...
US
Nov Inc
NYSE:NOV
7.1B USD
Loading...
Loading...
Loading...
Loading...

Free Cash Flow

Free Cash Flow Analysis
Saipem SpA

Last Value
3-Years Average
FCF Margin
Conversion Rate
Get AI-powered insights for any company or topic.
Open AI Assistant

Intrinsic Value is all-important and is the only logical way to evaluate the relative attractiveness of investments and businesses.

Warren Buffett