
Saudi Arabian Oil Co
SAU:2222

Decide at what price you'd be comfortable buying and we'll help you stay ready.

|
Johnson & Johnson
NYSE:JNJ
|
US |

|
Berkshire Hathaway Inc
NYSE:BRK.A
|
US |

|
Bank of America Corp
NYSE:BAC
|
US |

|
Mastercard Inc
NYSE:MA
|
US |

|
UnitedHealth Group Inc
NYSE:UNH
|
US |

|
Exxon Mobil Corp
NYSE:XOM
|
US |

|
Pfizer Inc
NYSE:PFE
|
US |

|
Nike Inc
NYSE:NKE
|
US |

|
Visa Inc
NYSE:V
|
US |

|
Alibaba Group Holding Ltd
NYSE:BABA
|
CN |

|
JPMorgan Chase & Co
NYSE:JPM
|
US |

|
Coca-Cola Co
NYSE:KO
|
US |

|
Verizon Communications Inc
NYSE:VZ
|
US |

|
Chevron Corp
NYSE:CVX
|
US |

|
Walt Disney Co
NYSE:DIS
|
US |

|
PayPal Holdings Inc
NASDAQ:PYPL
|
US |
 Saudi Arabian Oil Co
Cash from Investing Activities
Saudi Arabian Oil Co
Cash from Investing Activities
Saudi Arabian Oil Co
Cash from Investing Activities Peer Comparison
Competitors Analysis
Latest Figures & CAGR of Competitors
| Company | Cash from Investing Activities | CAGR 3Y | CAGR 5Y | CAGR 10Y | ||
|---|---|---|---|---|---|---|
|
|
Saudi Arabian Oil Co
SAU:2222
|
Cash from Investing Activities
-﷼203.9B
|
CAGR 3-Years
19%
|
CAGR 5-Years
-58%
|
CAGR 10-Years
N/A
|
|
Saudi Arabian Oil Co
Glance View
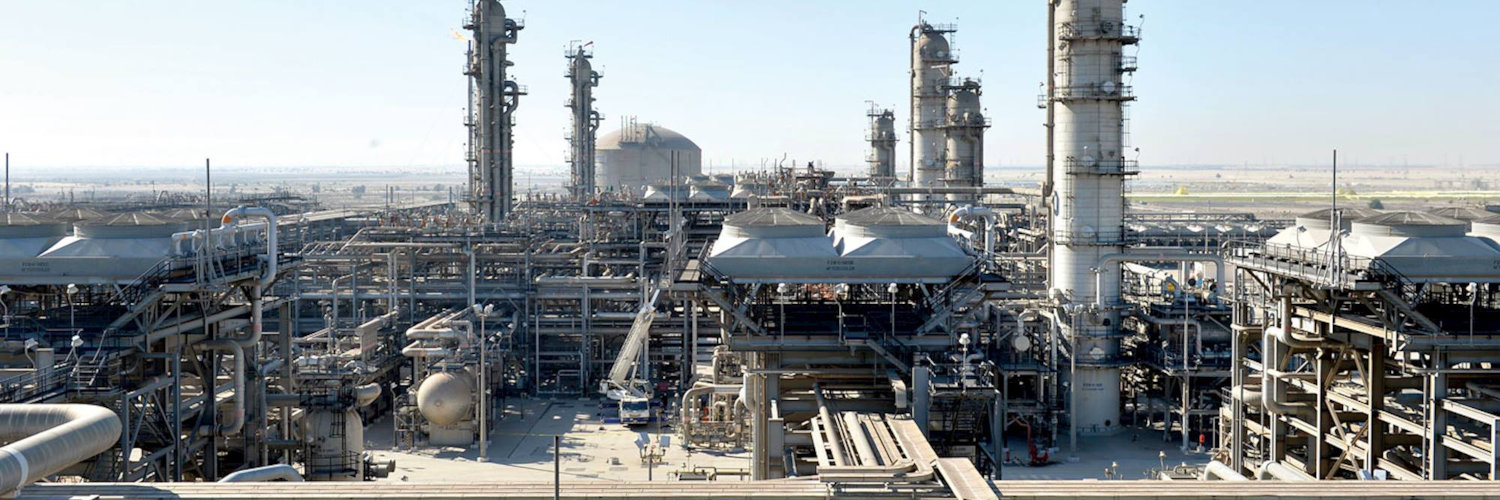
In the heart of the Arabian desert, among imposing dunes and sweeping horizons, Saudi Arabian Oil Co., commonly known as Saudi Aramco, has carved its place not just as an oil giant but as a pivotal player in the global energy narrative. Established in 1933 and primarily owned by the Kingdom of Saudi Arabia, Aramco's journey from its humble beginnings to becoming a juggernaut in the petroleum sector is a tale intertwined with the country's own transformation. It manages the vast oil reserves buried beneath the Saudi sands and boasts a sophisticated infrastructure of refineries, pipelines, and shipping routes that help transport its liquid gold to every corner of the globe. The company seamlessly integrates various stages of oil production, from exploration and extraction to refining and distribution, ensuring a smooth operational flow that maximizes efficiency and scale, which are critical to its profitability. Aramco's business model is rooted in its vast reserves of crude oil, the largest known in the world. Leveraging cutting-edge technology and an experienced workforce, the company engages in the upstream business of exploring and producing crude oil and gas and the downstream activities that include refining, distribution, and marketing of petrochemicals and derivatives. This vertical integration not only fuels the kingdom's economy but also provides Aramco with a buffer against volatility in oil prices through diversification. Beyond petroleum, the company is ambitiously investing in research on sustainable and alternative energy sources, recognizing the shifting currents towards greener solutions. This strategic vision positions Aramco at the forefront of both contemporary energy demands and future growth prospects, solidifying its status as a cornerstone of the global energy supply chain.
See Also
What is Saudi Arabian Oil Co's Cash from Investing Activities?
Cash from Investing Activities
-203.9B
SAR
Based on the financial report for Dec 31, 2025, Saudi Arabian Oil Co's Cash from Investing Activities amounts to -203.9B SAR.
What is Saudi Arabian Oil Co's Cash from Investing Activities growth rate?
Cash from Investing Activities CAGR 5Y
-58%
Over the last year, the Cash from Investing Activities growth was -7 027%. The average annual Cash from Investing Activities growth rates for Saudi Arabian Oil Co have been 19% over the past three years , -58% over the past five years .
