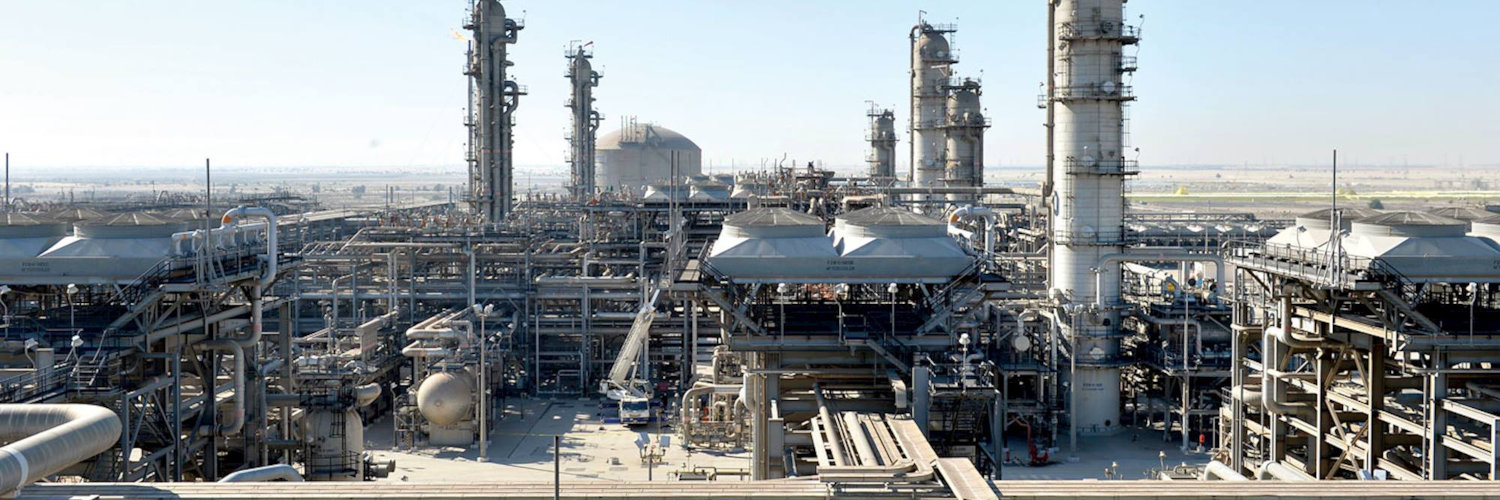

Saudi Arabian Oil Co
SAU:2222

Decide at what price you'd be comfortable buying and we'll help you stay ready.

|
Saudi Arabian Oil Co
SAU:2222
|
SA |
|
D
|
DBS Group Holdings Ltd
SWB:DEVL
|
SG |

|
Tesco PLC
LSE:TSCO
|
UK |
|
D
|
Duke Energy Corp
XMUN:D2MN
|
US |

|
Suncor Energy Inc
TSX:SU
|
CA |
|
A
|
Amdocs Ltd
XMUN:AOS
|
US |

|
Nexi SpA
F:N0X0
|
IT |
|
A
|
Adecco Group AG
XHAM:ADI1
|
CH |
|
Ggx Gold Corp
XTSX:GGX
|
CA |
|
V
|
Vinci SA
DUS:SQU
|
FR |
|
M
|
Mondi PLC
F:KYC0
|
UK |
|
L
|
Lenzing AG
XMUN:LEN
|
AT |
|
I
|
Interpublic Group of Companies Inc
SWB:IPG
|
US |
|
C
|
Cerrado Gold Corp
OTC:CRDOF
|
CA |

|
Ranpak Holdings Corp
F:0ZA
|
US |

|
Carvana Co
LSE:0A79
|
US |

|
People.cn Co Ltd
SSE:603000
|
CN |
|
E
|
Estee Lauder Companies Inc
DUS:ELAA
|
US |
|
B
|
BlackBerry Ltd
NYSE:BB
|
CA |
|
C
|
Corporate Office Properties Trust
F:WX7
|
US |
|
D
|
DBS Group Holdings Ltd
XBER:DEVL
|
SG |

|
Evertec Inc
F:2EV
|
PR |

|
Mueller Industries Inc
NYSE:MLI
|
US |
|
S
|
Suncor Energy Inc
DUS:SM3
|
CA |
Intrinsic Value
The intrinsic value for Saudi Arabian Oil Co (2222) under the Base Case is hidden
SAR.
Compared with the current market price of 27.75 SAR, the stock appears hidden
.
Saudi Arabian Oil Co looks overvalued. Yet it might still be cheap by its own standards. Some stocks live permanently above intrinsic value; Historical Valuation reveals whether Saudi Arabian Oil Co usually does or if today's premium is unusual.
Learn how current stock valuations stack up against historical averages to gauge true investment potential.

Let our AI compare Alpha Spread’s intrinsic value with external valuations from Simply Wall St, GuruFocus, ValueInvesting.io, Seeking Alpha, and others.
Let our AI break down the key assumptions behind the intrinsic value calculation for Saudi Arabian Oil Co.

The intrinsic value for Saudi Arabian Oil Co (2222) under the Base Case is hidden SAR.
Compared with the current market price of 27.75 SAR, the stock appears hidden.
