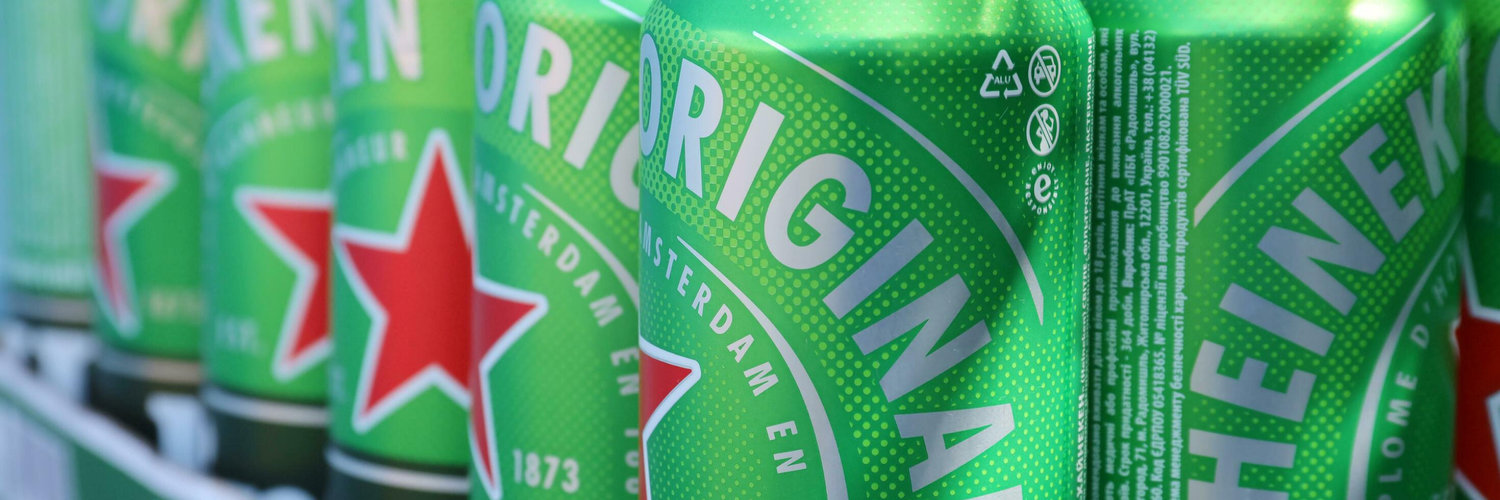
Heineken Holding NV
SWB:4H5

Decide at what price you'd be comfortable buying and we'll help you stay ready.
|
H
|
Heineken Holding NV
SWB:4H5
|
NL |
|
E
|
Exact Sciences Corp
SWB:EXK
|
US |

|
Kakaku.com Inc
F:KKC
|
JP |

|
Hindustan Construction Company Ltd
NSE:HCC
|
IN |
|
D
|
Domino's Pizza Group PLC
SWB:DKOB
|
UK |
|
C
|
Commerzbank AG
F:ZZMS
|
DE |

|
Aban Offshore Ltd
NSE:ABAN
|
IN |
|
C
|
Corsa Coal Corp
OTC:CRSXF
|
US |

|
Canaan Inc
NASDAQ:CAN
|
CN |
|
K
|
Kahoot ASA
XMUN:KAH
|
NO |

|
Antares Vision SpA
F:2YK
|
IT |
|
M
|
Mitsubishi Chemical Holdings Corp
F:M3C
|
JP |

|
Summerset Group Holdings Ltd
NZX:SUM
|
NZ |
|
Kodal Minerals PLC
F:7UE
|
UK |

|
Auto Partner SA
F:6KF
|
PL |

|
Equinox Gold Corp
TSX:EQX
|
CA |
|
L
|
Lululemon Athletica Inc
F:33L
|
CA |

|
Aptus Value Housing Finance India Ltd
NSE:APTUS
|
IN |
|
Digimarc Corp
NASDAQ:DMRC
|
US |
|
M
|
Mahindra and Mahindra Ltd
NSE:M&M
|
IN |
Dividends
Dividend Yield
Heineken Holding NV

| Current Yield | |
| Min Yield | |
| Max Yield | |
| Average Yield | |
| Median Yield |
Dividend Per Share
Heineken Holding NV
4H5 have increased by 339%.
Payout Ratio
Heineken Holding NV
Peers Comparison
Dividends
Shareholder Yield
Current shareholder yield for 4H5 is
hidden
.
Peers Comparison
Shareholder Yield
Buybacks
Buyback Yield measures how much a company reduces its outstanding shares through repurchases, expressed as a percentage.
This metric directly reflects the company’s efforts to return value to shareholders. By reducing the number of shares, buybacks can increase earnings per share and potentially boost the stock's price.

Peers Comparison
Buybacks
Debt Paydown
Debt Paydown Yield measures the amount of debt a company repays within a specific period, shown as a percentage of its market capitalization.
This metric indicates how the company is using its capital to decrease financial liabilities, which can strengthen its financial health and potentially enhance shareholder value.
Peers Comparison
Debt Paydown
Price Appreciation
4H5 Price
Heineken Holding NV
| Average Annual Return | -6.7% |
| Standard Deviation of Annual Returns | 13.9% |
| Max Drawdown | -37% |
| Market Capitalization | 16.9B EUR |
| Shares Outstanding | 282 873 387 |
| Percentage of Shares Shorted |
N/A
|
