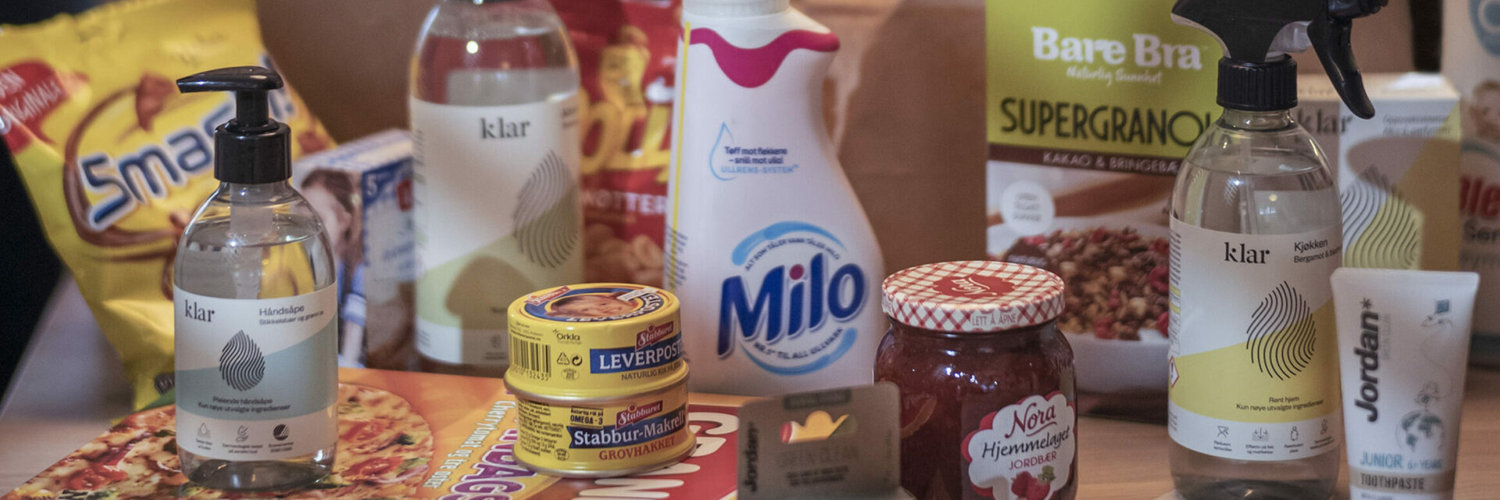

Orkla ASA
SWB:OKL

Decide at what price you'd be comfortable buying and we'll help you stay ready.
|
O
|
Orkla ASA
SWB:OKL
|
NO |
|
N
|
Nokia Oyj
DUS:NOA3
|
FI |
|
W
|
Walmart Inc
SWB:WMT
|
US |

|
Credit Agricole SA
XETRA:XCA
|
FR |
|
V
|
Verint Systems Inc
DUS:VTY
|
US |
|
A
|
Arbor Realty Trust Inc
XBER:OWQ
|
US |

|
Sappi Ltd
F:SPI
|
ZA |
|
Pegasystems Inc
NASDAQ:PEGA
|
US |

|
Assetco PLC
F:DYJ
|
UK |
|
C
|
CDL Hospitality Trusts
SGX:J85
|
SG |

|
thyssenkrupp AG
F:TKA
|
DE |

|
Santec Corp
TSE:6777
|
JP |
Dividends
Dividend Yield
Orkla ASA

| Current Yield | |
| Min Yield | |
| Max Yield | |
| Average Yield | |
| Median Yield |
Dividend Per Share
Orkla ASA
OKL have decreased by 47%.
Payout Ratio
Orkla ASA
Peers Comparison
Dividends
Shareholder Yield
Current shareholder yield for OKL is
hidden
.
Peers Comparison
Shareholder Yield
Buybacks
Buyback Yield measures how much a company reduces its outstanding shares through repurchases, expressed as a percentage.
This metric directly reflects the company’s efforts to return value to shareholders. By reducing the number of shares, buybacks can increase earnings per share and potentially boost the stock's price.

Peers Comparison
Buybacks
Debt Paydown
Debt Paydown Yield measures the amount of debt a company repays within a specific period, shown as a percentage of its market capitalization.
This metric indicates how the company is using its capital to decrease financial liabilities, which can strengthen its financial health and potentially enhance shareholder value.
Peers Comparison
Debt Paydown
Price Appreciation
OKL Price
Orkla ASA
| Average Annual Return | 14.36% |
| Standard Deviation of Annual Returns | 8.65% |
| Max Drawdown | -58% |
| Market Capitalization | 105.5B EUR |
| Shares Outstanding | 998 400 712 |
| Percentage of Shares Shorted |
N/A
|
