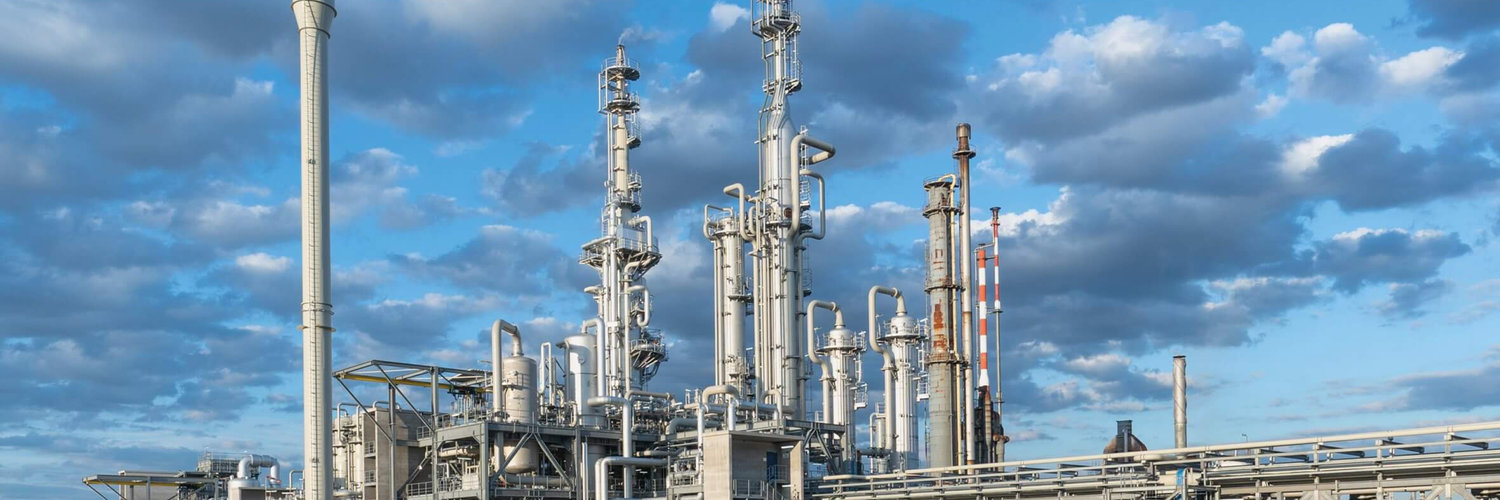
AltaGas Ltd
TSX:ALA

Watchlist Manager
AltaGas Ltd Logo
AltaGas Ltd
TSX:ALA
Watchlist
Price: 38.25 CAD -0.16% Market Closed
Market Cap: 11.4B CAD

Profitability Summary

AltaGas Ltd's profitability score is hidden . We take all the information about a company's profitability (such as its margins, capital efficiency, free cash flow generating ability, and more) and consolidate it into one single number - the profitability score. The higher the profitability score, the more profitable the company is.

Sign Up to see
Profitability Score
Sign In
Sign Up

We take all the information about a company's profitability (such as its margins, capital efficiency, free cash flow generating ability, and more) and consolidate it into one single number - the profitability score. The higher the profitability score, the more profitable the company is.

Past Growth

Analyzing past growth in Revenue, Operating Income, and Net Income allows investors to assess the company's profitability and operational efficiency. Consistent improvement in these metrics typically signals long-term strength and stability.

Show More Less

Margins

Profit margins represent what percentage of sales has turned into profits. Simply put, the percentage figure indicates how many cents of profit the company has generated for each dollar of sale.

Profit margins help investors assess if a company's management is generating enough profit from its sales and whether operating costs and overhead costs are being contained.

Show More Less

Earnings Waterfall
AltaGas Ltd

Revenue
12.8B CAD
Cost of Revenue
-9.5B CAD
Gross Profit
3.3B CAD
Operating Expenses
-2.3B CAD
Operating Income
1B CAD
Other Expenses
-455m CAD
Net Income
562m CAD

Margins Comparison
AltaGas Ltd Competitors

Country Company Market Cap Gross
Margin
Operating
Margin
Net
Margin
CA
AltaGas Ltd
TSX:ALA
11.4B CAD
26%
8%
4%
ES
Naturgy Energy Group SA
MAD:NTGY
25.7B EUR
40%
20%
10%
US
Atmos Energy Corp
NYSE:ATO
24.2B USD
78%
33%
25%
IT
Snam SpA
MIL:SRG
17.7B EUR
0%
48%
38%
HK
Hong Kong and China Gas Co Ltd
HKEX:3
123.3B HKD
42%
15%
10%
IN
GAIL (India) Ltd
NSE:GAIL
1.2T INR
18%
10%
9%
JP
Tokyo Gas Co Ltd
TSE:9531
1.8T JPY
15%
5%
3%
JP
Osaka Gas Co Ltd
TSE:9532
1.5T JPY
20%
8%
7%
CN
ENN Energy Holdings Ltd
HKEX:2688
71.8B HKD
12%
8%
5%
HK
Kunlun Energy Company Ltd
HKEX:135
67.2B HKD
10%
6%
3%
MY
Petronas Gas Bhd
KLSE:PETGAS
35.7B MYR
35%
35%
28%

Return on Capital

Return on capital ratios give a sense of how well a company is using its capital (equity, assets, capital employed, etc.) to generate profits (operating income, net income, etc.). In simple words, these ratios show how much income is generated for each dollar of capital invested.

Show More Less

Return on Capital Comparison
AltaGas Ltd Competitors

Country Company Market Cap ROE ROA ROCE ROIC
CA
AltaGas Ltd
TSX:ALA
11.4B CAD
6%
2%
5%
4%
ES
Naturgy Energy Group SA
MAD:NTGY
25.7B EUR
20%
5%
12%
10%
US
Atmos Energy Corp
NYSE:ATO
24.2B USD
9%
4%
6%
5%
IT
Snam SpA
MIL:SRG
17.7B EUR
25%
6%
11%
6%
HK
Hong Kong and China Gas Co Ltd
HKEX:3
123.3B HKD
10%
4%
7%
5%
IN
GAIL (India) Ltd
NSE:GAIL
1.2T INR
15%
10%
13%
9%
JP
Tokyo Gas Co Ltd
TSE:9531
1.8T JPY
4%
2%
4%
3%
JP
Osaka Gas Co Ltd
TSE:9532
1.5T JPY
8%
4%
6%
4%
CN
ENN Energy Holdings Ltd
HKEX:2688
71.8B HKD
14%
6%
12%
8%
HK
Kunlun Energy Company Ltd
HKEX:135
67.2B HKD
9%
4%
11%
13%
MY
Petronas Gas Bhd
KLSE:PETGAS
35.7B MYR
13%
10%
13%
13%

Free Cash Flow

Free cash flow (FCF) is the money a company has left over after paying its operating expenses and capital expenditures. The more free cash flow a company has, the more it can allocate to dividends, paying down debt, and growth opportunities.

If a company has a decreasing free cash flow, that is not necessarily bad if the company is investing in its growth.

Show More Less