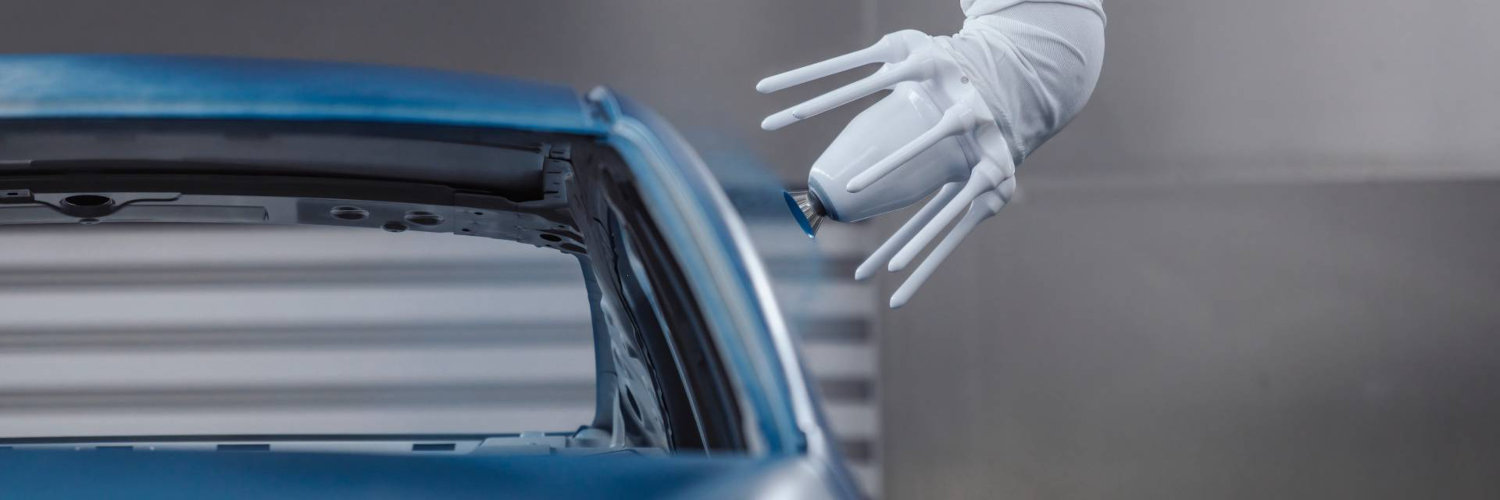
First Time Loading...

Duerr AG
XETRA:DUE

Watchlist Manager
Duerr AG Logo
Duerr AG
XETRA:DUE
Watchlist
Price: 23.12 EUR 3.49% Market Closed
Updated: Apr 27, 2024

Intrinsic Value

Dürr AG operates is a mechanical and plant engineering firms. [ Read More ]

The intrinsic value of one DUE stock under the Base Case scenario is 47.68 EUR. Compared to the current market price of 23.12 EUR, Duerr AG is Undervalued by 52%.

Key Points:
DUE Intrinsic Value
Base Case
47.68 EUR
Undervaluation 52%
Intrinsic Value
Price
Worst Case
Base Case
Best Case

Valuation Backtest
Duerr AG

Backtest Intrinsic Value
Dive into the past to invest in the future

Run backtest to discover the historical profit from buying and selling DUE stocks based on their intrinsic value.

Analyze the historical link between intrinsic value and market price to make more informed investment decisions.

Run Backtest
Settings
Valuation Methods
Buy/Sell Thresholds
Buy When:
%
Sell When:
%
B
S
Run Backtest
How does it work?

Fundamental Analysis

Beta
Ask me anything about
Duerr AG

Provide an overview of the primary business activities
of Duerr AG.

What unique competitive advantages
does Duerr AG hold over its rivals?

What risks and challenges
does Duerr AG face in the near future?

Summarize the latest earnings call
of Duerr AG.

Is it considered overvalued or undervalued
based on the latest financial data?

Show all valuation multiples
for Duerr AG.

Provide P/S
for Duerr AG.

Provide P/E
for Duerr AG.

Provide P/OCF
for Duerr AG.

Provide P/FCFE
for Duerr AG.

Provide P/B
for Duerr AG.

Provide EV/S
for Duerr AG.

Provide EV/GP
for Duerr AG.

Provide EV/EBITDA
for Duerr AG.

Provide EV/EBIT
for Duerr AG.

Provide EV/OCF
for Duerr AG.

Provide EV/FCFF
for Duerr AG.

Provide EV/IC
for Duerr AG.

Show me price targets
for Duerr AG made by professional analysts.

What are the Revenue projections
for Duerr AG?

How accurate were the past Revenue estimates
for Duerr AG?

What are the Net Income projections
for Duerr AG?

How accurate were the past Net Income estimates
for Duerr AG?

What are the EPS projections
for Duerr AG?

How accurate were the past EPS estimates
for Duerr AG?

What are the EBIT projections
for Duerr AG?

How accurate were the past EBIT estimates
for Duerr AG?

Compare the revenue forecasts
for Duerr AG with those of its competitors based on recent analyst estimates.

Compare the intrinsic valuations
of Duerr AG and its key competitors using the latest financial data.

Compare historical revenue growth rates
of Duerr AG against its competitors.

Analyze the profit margins
(gross, operating, and net) of Duerr AG compared to its peers.

Compare the P/E ratios
of Duerr AG against its peers.

Discuss the investment returns and shareholder value creation
comparing Duerr AG with its peers.

Analyze the financial leverage
of Duerr AG compared to its main competitors.

Show all profitability ratios
for Duerr AG.

Provide ROE
for Duerr AG.

Provide ROA
for Duerr AG.

Provide ROIC
for Duerr AG.

Provide ROCE
for Duerr AG.

Provide Gross Margin
for Duerr AG.

Provide Operating Margin
for Duerr AG.

Provide Net Margin
for Duerr AG.

Provide FCF Margin
for Duerr AG.

Show all solvency ratios
for Duerr AG.

Provide D/E Ratio
for Duerr AG.

Provide D/A Ratio
for Duerr AG.

Provide Interest Coverage Ratio
for Duerr AG.

Provide Altman Z-Score Ratio
for Duerr AG.

Provide Quick Ratio
for Duerr AG.

Provide Current Ratio
for Duerr AG.

Provide Cash Ratio
for Duerr AG.

What is the historical Revenue growth
over the last 5 years for Duerr AG?

What is the historical Net Income growth
over the last 5 years for Duerr AG?

What is the current Free Cash Flow
of Duerr AG?

Discuss the annual earnings per share (EPS)
trend over the past five years for Duerr AG.

Financials

Balance Sheet Decomposition
Duerr AG

Current Assets 3.2B
Cash & Short-Term Investments 1.1B
Receivables 1.3B
Other Current Assets 851.7m
Non-Current Assets 1.9B
Long-Term Investments 55.4m
PP&E 655.2m
Intangibles 1.1B
Other Non-Current Assets 116.9m
Current Liabilities 2.8B
Accounts Payable 599m
Other Current Liabilities 2.2B
Non-Current Liabilities 1.2B
Long-Term Debt 1.1B
Other Non-Current Liabilities 165.3m
Efficiency

Earnings Waterfall
Duerr AG

Revenue
4.6B EUR
Cost of Revenue
-3.6B EUR
Gross Profit
1B EUR
Operating Expenses
-775.5m EUR
Operating Income
230.2m EUR
Other Expenses
-118.2m EUR
Net Income
112m EUR

Free Cash Flow Analysis
Duerr AG

Last Value
3-Years Average
FCF Margin
Conversion Rate
History
Components
Chart
Table
Fundamental Scores

DUE Profitability Score
Profitability Due Diligence

Duerr AG's profitability score is 50/100. The higher the profitability score, the more profitable the company is.

ROE is Increasing
Positive 3-Years Revenue Growth
Positive Gross Profit
Positive Free Cash Flow
50/100
Profitability
Score

Duerr AG's profitability score is 50/100. The higher the profitability score, the more profitable the company is.

DUE Solvency Score
Solvency Due Diligence

Duerr AG's solvency score is 43/100. The higher the solvency score, the more solvent the company is.

Negative Net Debt
Long-Term Solvency
Low D/E
Short-Term Solvency
43/100
Solvency
Score

Duerr AG's solvency score is 43/100. The higher the solvency score, the more solvent the company is.

Wall St
Price Targets

DUE Price Targets Summary
Duerr AG

Wall Street analysts forecast DUE stock price to rise over the next 12 months.

According to Wall Street analysts, the average 1-year price target for DUE is 28.12 EUR with a low forecast of 22.22 EUR and a high forecast of 42 EUR.

Lowest
Price Target
22.22 EUR
4% Downside
Average
Price Target
28.12 EUR
22% Upside
Highest
Price Target
42 EUR
82% Upside
View Analyst Estimates

Competitive Landscape

Shareholder Return

DUE Price
Duerr AG

1M 1M
+8%
6M 6M
+20%
1Y 1Y
-24%
3Y 3Y
-34%
5Y 5Y
-36%
10Y 10Y
+8%
Annual Price Range
23.12
52w Low
18.94
52w High
31.74
Price Metrics
Average Annual Return -1.57%
Standard Deviation of Annual Returns 22.01%
Max Drawdown -58%
Shares Statistics
Market Capitalization 1.6B EUR
Shares Outstanding 69 202 100
Percentage of Shares Shorted
N/A

DUE Return Decomposition
Main factors of price return

What is price return decomposition?

Company Profile

Duerr AG Logo
Duerr AG

Country

Germany

Industry

Machinery

Market Cap

1.6B EUR

Dividend Yield

3.07%

Description

Dürr AG operates is a mechanical and plant engineering firms. The company is headquartered in Bietigheim-Bissingen, Baden-Wuerttemberg and currently employs 17,802 full-time employees. The company operates through five business divisions: Paint and Assembly Systems; Application Technology; Measuring and Process Systems, Clean Technology Systems, and Wood Processing Systems. The Paint and Assembly Systems segment includes planning and building of paint shops and assembly lines for the automobile industry as well as painting and assembling of systems for aircraft construction. The Application Technology segment focuses on solutions for automated spray application of paint. The Measuring and Process Systems, comprising balancing and diagnostics systems, among others. The Clean Technology Systems division entails services like energy management and consulting. The firm's wood-processing technology is included in the Wood Processing Systems division. Its subsidiaries include Bersch & Fratscher GmbH, EST+ a.s., as well as iTAC Software AG.

Contact

BADEN-WUERTTEMBERG
Bietigheim-Bissingen
Carl-Benz-Strasse 34
+497142780.0
https://www.durr.com/

IPO

1990-01-04

Employees

17 802

Officers

CEO & Chairman of Management Board
Dr. Jochen Weyrauch
CFO & Member of Management Board
Mr. Dietmar Heinrich
Vice President of Corporate Communications & Investor Relations
Mr. Andreas Schaller
Head of Personnel Development
Mr. Paul Eckert
Chief Executive Officer of Woodworking Machinery & Systems Division
Dr. Daniel Schmitt
Chief Executive Officer of Division Application Technology
Dr. Lars Friedrich
Show More
Chief Executive Officer of Paint & Final Assembly Systems Division
Bruno Welsch
Chief Executive Officer of Industrial Automation Systems Division
Jorg Brunke
Chief Executive Officer of Clean Technology Systems Division
Dr. Hannes Schmüser
Show Less

See Also

Discover More
What is the Intrinsic Value of one DUE stock?

The intrinsic value of one DUE stock under the Base Case scenario is 47.68 EUR.

Is DUE stock undervalued or overvalued?

Compared to the current market price of 23.12 EUR, Duerr AG is Undervalued by 52%.