Nissin Foods Holdings Co Ltd
XMUN:NF2

Decide at what price you'd be comfortable buying and we'll help you stay ready.
|
N
|
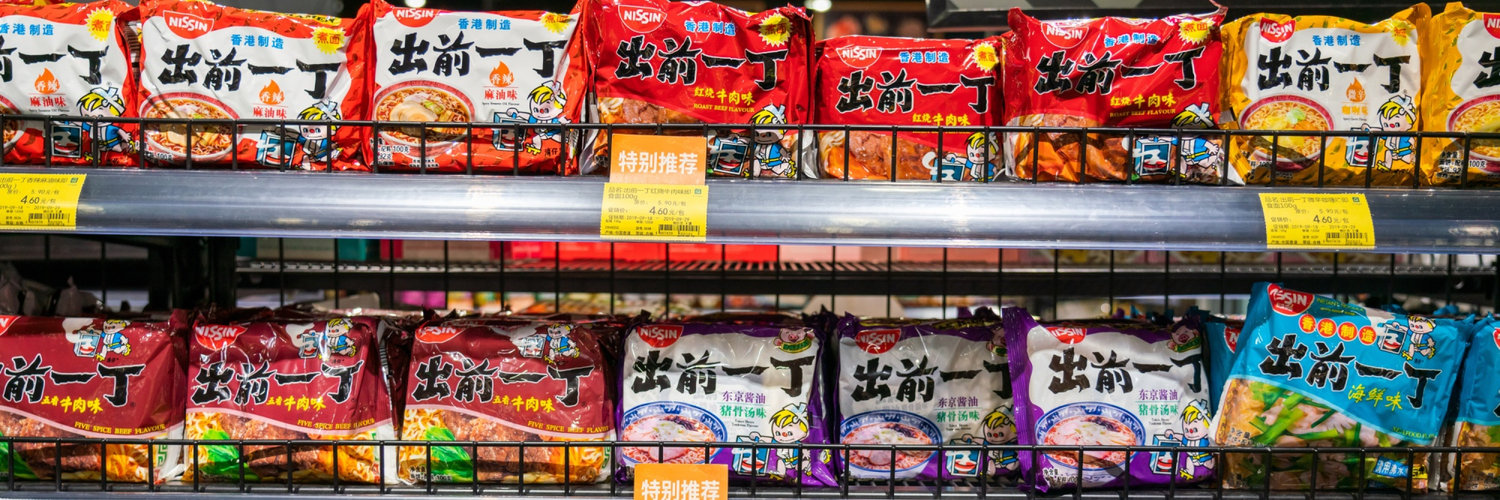
Nissin Foods Holdings Co Ltd
XMUN:NF2
|
JP |

|
Life360 Inc
ASX:360
|
US |

|
Philex Mining Corp
F:0PX
|
PH |
|
I
|
International Flavors & Fragrances Inc
F:IFF
|
US |

|
TotalEnergies SE
PAR:TTE
|
FR |
|
P
|
PICC Property and Casualty Co Ltd
F:PJC
|
CN |
|
O
|
Organon & Co
F:7XP
|
US |

|
Blue Hat Interactive Entertainment Technology
F:4Y80
|
CN |

|
TYMLEZ Group Ltd
ASX:TYM
|
AU |
|
A
|
ALLETE Inc
F:AEBA
|
US |

|
Bunge Global SA
F:Q23
|
US |

|
La Francaise de l Energie SA
F:LFX
|
FR |
Dividends
Dividend Yield
Nissin Foods Holdings Co Ltd

| Current Yield | |
| Min Yield | |
| Max Yield | |
| Average Yield | |
| Median Yield |
Dividend Per Share
Nissin Foods Holdings Co Ltd
NF2 have increased by 163%.
Payout Ratio
Nissin Foods Holdings Co Ltd
Peers Comparison
Dividends
Shareholder Yield
Current shareholder yield for NF2 is
hidden
.
Peers Comparison
Shareholder Yield
Buybacks
Buyback Yield measures how much a company reduces its outstanding shares through repurchases, expressed as a percentage.
This metric directly reflects the company’s efforts to return value to shareholders. By reducing the number of shares, buybacks can increase earnings per share and potentially boost the stock's price.

Peers Comparison
Buybacks
Debt Paydown
Debt Paydown Yield measures the amount of debt a company repays within a specific period, shown as a percentage of its market capitalization.
This metric indicates how the company is using its capital to decrease financial liabilities, which can strengthen its financial health and potentially enhance shareholder value.
Peers Comparison
Debt Paydown
Price Appreciation
NF2 Price
Nissin Foods Holdings Co Ltd
| Average Annual Return | 25.93% |
| Standard Deviation of Annual Returns | 48.08% |
| Max Drawdown | -57% |
| Market Capitalization | 830.6B EUR |
| Shares Outstanding | 304 038 939 |
| Percentage of Shares Shorted |
N/A
|
NF2 Return Decomposition
Main factors of price return
Stock Splits
NF2's latest stock split occurred on Dec 28, 2023
The company executed a 3-for-1 stock split, meaning that for every share held, investors received 3 new shares.
Before the split, NF2 traded at 31 per share. Afterward, the share price was about 31.8.
The adjusted shares began trading on Dec 28, 2023. This was the only stock split in NF2's history.
