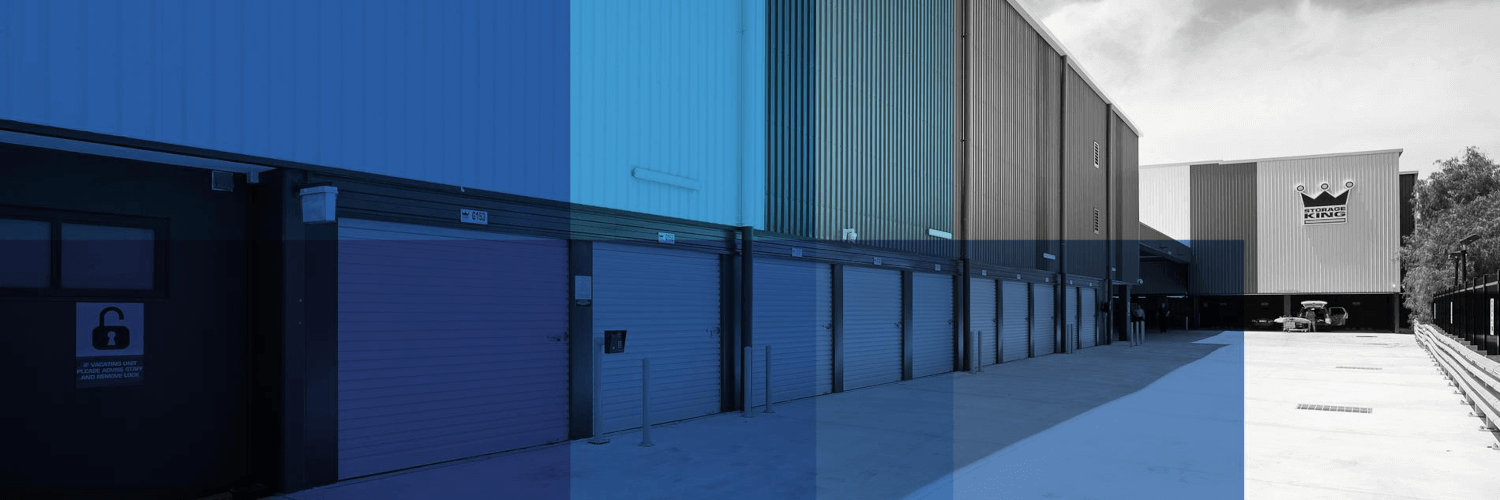

Abacus Property Group
ASX:ABP
Abacus Property Group
ASX:ABP
Price:
1.06
AUD
Market Closed
Market Cap:
AU$947.3m

Add Note
Add Target
Capture your thoughts and set a target
Decide at what price you'd be comfortable buying and we'll help you stay ready.
Based on
Margin of Safety
0%
10%
20%
30%
40%
50%
Your Price Target
Linked to
current price
· In Buy Zone
Loading
Note attached
Choose the stock you wish to monitor with a price target
Recently Viewed

|
Abacus Property Group
ASX:ABP
|
AU |

|
Finolex Industries Ltd
NSE:FINPIPE
|
IN |

|
Redde Northgate PLC
LSE:REDD
|
UK |
|
T
|
TMT Steel PCL
SET:TMT
|
TH |

|
Bank Raya Indonesia Tbk PT
IDX:AGRO
|
ID |

|
China Construction Bank Corp
OTC:CICHF
|
CN |

