


Coppermoly Ltd
ASX:COY


Utilize notes to systematically review your investment decisions. By reflecting on past outcomes, you can discern effective strategies and identify those that underperformed. This continuous feedback loop enables you to adapt and refine your approach, optimizing for future success.
Each note serves as a learning point, offering insights into your decision-making processes. Over time, you'll accumulate a personalized database of knowledge, enhancing your ability to make informed decisions quickly and effectively.
With a comprehensive record of your investment history at your fingertips, you can compare current opportunities against past experiences. This not only bolsters your confidence but also ensures that each decision is grounded in a well-documented rationale.
Do you really want to delete this note?
This action cannot be undone.

| 52 Week Range |
0.008
0.017
|
| Price Target |
|
We'll email you a reminder when the closing price reaches AUD.
Choose the stock you wish to monitor with a price alert.
This alert will be permanently deleted.
Operating Margin
Operating Margin shows how much profit a company makes from its regular business activities after covering operating costs. It helps measure how efficiently the company turns sales into profit.
Operating Margin shows how much profit a company makes from its regular business activities after covering operating costs. It helps measure how efficiently the company turns sales into profit.
Peer Comparison
| Country | Company | Market Cap |
Operating Margin |
||
|---|---|---|---|---|---|
| AU |
|
Coppermoly Ltd
ASX:COY
|
8.8m AUD |
Loading...
|
|
| AU |

|
BHP Group Ltd
ASX:BHP
|
245.8B AUD |
Loading...
|
|
| AU |

|
Rio Tinto Ltd
ASX:RIO
|
241.5B AUD |
Loading...
|
|
| UK |

|
Rio Tinto PLC
LSE:RIO
|
106.9B GBP |
Loading...
|
|
| MX |

|
Grupo Mexico SAB de CV
BMV:GMEXICOB
|
1.5T MXN |
Loading...
|
|
| CH |

|
Glencore PLC
LSE:GLEN
|
59.4B GBP |
Loading...
|
|
| CN |

|
CMOC Group Ltd
SSE:603993
|
486.9B CNY |
Loading...
|
|
| SA |

|
Saudi Arabian Mining Company SJSC
SAU:1211
|
248.9B SAR |
Loading...
|
|
| CN |
C
|
China Molybdenum Co Ltd
OTC:CMCLF
|
60.8B USD |
Loading...
|
|
| UK |

|
Anglo American PLC
LSE:AAL
|
40.1B GBP |
Loading...
|
|
| RU |

|
GMK Noril'skiy Nikel' PAO
MOEX:GMKN
|
2.5T RUB |
Loading...
|
Market Distribution
| Min | -14 949 200% |
| 30th Percentile | -526.4% |
| Median | -25.2% |
| 70th Percentile | 6.1% |
| Max | 145 596.9% |
Other Profitability Ratios
Coppermoly Ltd
Glance View
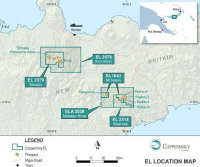
Coppermoly Ltd. is an exploration and development company, which explores and evaluates copper, gold, molybdenum and gold deposits in Papua New Guinea. The company is headquartered in Brisbane, Queensland. The company went IPO on 2008-01-31. The firm has a portfolio of copper and gold projects in the South West Pacific nation of Papua New Guinea. The firm's tenements include Mt Nakru, Simuku, Mak Mak, Kori River and Metelen River. Its Mt Nakru tenement having exploration license EL 1043, covers approximately 47 square kilometers and encloses approximately four copper-gold systems known as Nakru-01 to Nakru-04. Its Simuku tenement having exploration license EL2379, covers approximately 122.7 square kilometers. Its Mak Mak tenement having exploration license EL2514, covers approximately 269 square kilometers. Its Kori River tenement having exploration license EL 2578, comprises approximately 116 sub-blocks, covering an area of approximately 315 square kilometers. Its Metelen River tenement having exploration license application ELA 2638, occupies an area of approximately 246 square kilometers.
See Also
Operating Margin is calculated by dividing the Operating Income by the Revenue.
The current Operating Margin for Coppermoly Ltd is -3 476.3%, which is above its 3-year median of -7 237.1%.
Over the last 3 years, Coppermoly Ltd’s Operating Margin has increased from -231 675% to -3 476.3%. During this period, it reached a low of -231 675% on Dec 1, 2021 and a high of -3 060.9% on Jun 30, 2024.

