ioneer Ltd
ASX:INR

Decide at what price you'd be comfortable buying and we'll help you stay ready.

|
Johnson & Johnson
NYSE:JNJ
|
US |

|
Berkshire Hathaway Inc
NYSE:BRK.A
|
US |

|
Bank of America Corp
NYSE:BAC
|
US |

|
Mastercard Inc
NYSE:MA
|
US |

|
UnitedHealth Group Inc
NYSE:UNH
|
US |

|
Exxon Mobil Corp
NYSE:XOM
|
US |

|
Pfizer Inc
NYSE:PFE
|
US |

|
Nike Inc
NYSE:NKE
|
US |

|
Visa Inc
NYSE:V
|
US |

|
Alibaba Group Holding Ltd
NYSE:BABA
|
CN |

|
JPMorgan Chase & Co
NYSE:JPM
|
US |

|
Coca-Cola Co
NYSE:KO
|
US |

|
Verizon Communications Inc
NYSE:VZ
|
US |

|
Chevron Corp
NYSE:CVX
|
US |

|
Walt Disney Co
NYSE:DIS
|
US |

|
PayPal Holdings Inc
NASDAQ:PYPL
|
US |
EV/IC
Enterprise Value to Invested Capital (EV/IC) ratio compares a company`s total enterprise value to the capital invested in its business. It shows how efficiently the company`s market value reflects the funds used to generate returns.
Enterprise Value to Invested Capital (EV/IC) ratio compares a company`s total enterprise value to the capital invested in its business. It shows how efficiently the company`s market value reflects the funds used to generate returns.
Valuation Scenarios
If EV/IC returns to its 3-Year Average (1.7), the stock would be worth AU$0.17 (29% upside from current price).
| Scenario | EV/IC Value | Implied Price | Upside/Downside |
|---|---|---|---|
| Current Multiple | 1.3 | AU$0.14 |
0%
|
| 3-Year Average | 1.7 | AU$0.17 |
+29%
|
| 5-Year Average | 2.9 | AU$0.3 |
+122%
|
| Industry Average | 2.4 | AU$0.25 |
+83%
|
| Country Average | 1.7 | AU$0.18 |
+32%
|
Forward EV/IC
Today’s price vs future invested capital
Peer Comparison
| Market Cap | EV/IC | P/E | ||||
|---|---|---|---|---|---|---|
| AU |

|
ioneer Ltd
ASX:INR
|
415.1m AUD | 1.3 | -33 | |
| AU |

|
BHP Group Ltd
ASX:BHP
|
279B AUD | 2.2 | 19.2 | |
| AU |

|
Rio Tinto Ltd
ASX:RIO
|
279.2B AUD | 2.4 | 19.9 | |
| UK |

|
Rio Tinto PLC
LSE:RIO
|
120.1B GBP | 1.5 | 15.9 | |
| CH |

|
Glencore PLC
LSE:GLEN
|
66.1B GBP | 1.6 | 241.2 | |
| MX |

|
Grupo Mexico SAB de CV
BMV:GMEXICOB
|
1.5T MXN | 2.9 | 17.2 | |
| SA |

|
Saudi Arabian Mining Company SJSC
SAU:1211
|
248.9B SAR | 2.6 | 33.9 | |
| CN |

|
CMOC Group Ltd
SSE:603993
|
398.4B CNY | 2.4 | 19.6 | |
| UK |

|
Anglo American PLC
LSE:AAL
|
42.3B GBP | 1.5 | -15 | |
| CN |
C
|
China Molybdenum Co Ltd
OTC:CMCLF
|
45.9B USD | 1.9 | 15.5 | |
| ZA |
A
|
African Rainbow Minerals Ltd
JSE:ARI
|
43B ZAR | 0.5 | 33.3 |
Market Distribution
| Min | 0 |
| 30th Percentile | 1.1 |
| Median | 1.7 |
| 70th Percentile | 3.5 |
| Max | 3 073.7 |
Other Multiples
ioneer Ltd
Glance View
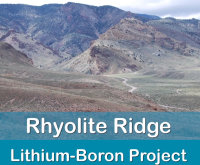
ioneer Ltd. operates as a mineral exploration company, which engages in the development of the Rhyolite Ridge Lithium-Boron deposit. The company is headquartered in North Sydney, New South Wales. The company went IPO on 2007-12-19. The firm is focused on its Rhyolite Ridge Lithium-Boron Project (Rhyolite Ridge) in Nevada, United States. The firm operates through two segments: North America and Australia. Rhyolite Ridge is a lithium and boron deposit, which is located approximately 25 kilometers west of Albemarle's Silver Peak lithium mine.
