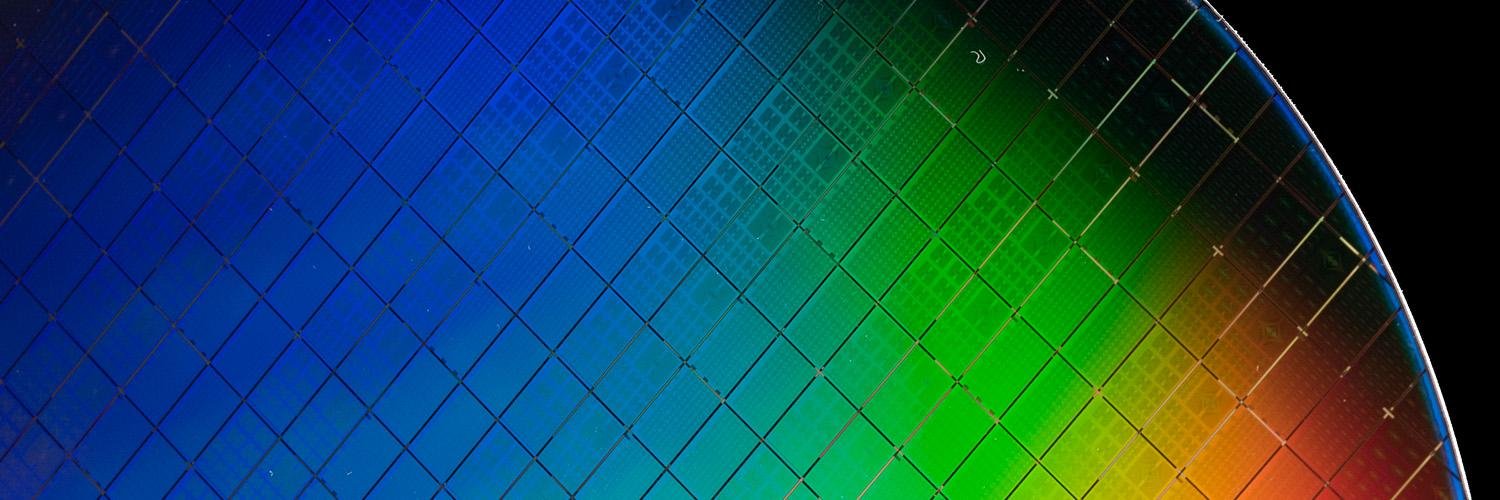
Intel Corp
BMV:INTC

Watchlist Manager
Intel Corp Logo
Intel Corp
BMV:INTC
Watchlist
Price: 648 MXN -0.92% Market Closed
Market Cap: 143.7B MXN

Profitability Summary

Intel Corp's profitability score is hidden . We take all the information about a company's profitability (such as its margins, capital efficiency, free cash flow generating ability, and more) and consolidate it into one single number - the profitability score. The higher the profitability score, the more profitable the company is.

Sign Up to see
Profitability Score
Sign In
Sign Up

We take all the information about a company's profitability (such as its margins, capital efficiency, free cash flow generating ability, and more) and consolidate it into one single number - the profitability score. The higher the profitability score, the more profitable the company is.

Past Growth

Analyzing past growth in Revenue, Operating Income, and Net Income allows investors to assess the company's profitability and operational efficiency. Consistent improvement in these metrics typically signals long-term strength and stability.

Show More Less

Margins

Profit margins represent what percentage of sales has turned into profits. Simply put, the percentage figure indicates how many cents of profit the company has generated for each dollar of sale.

Profit margins help investors assess if a company's management is generating enough profit from its sales and whether operating costs and overhead costs are being contained.

Show More Less

Earnings Waterfall
Intel Corp

Revenue
53.4B USD
Cost of Revenue
-34.4B USD
Gross Profit
19B USD
Operating Expenses
-19.1B USD
Operating Income
-104m USD
Other Expenses
302m USD
Net Income
198m USD

Margins Comparison
Intel Corp Competitors

Country Company Market Cap Gross
Margin
Operating
Margin
Net
Margin
US
Intel Corp
NASDAQ:INTC
173.2B USD
36%
0%
0%
US
NVIDIA Corp
NASDAQ:NVDA
4.6T USD
70%
59%
53%
US
Broadcom Inc
NASDAQ:AVGO
1.7T USD
68%
41%
36%
TW
Taiwan Semiconductor Manufacturing Co Ltd
TWSE:2330
38.8T TWD
59%
49%
44%
US
Advanced Micro Devices Inc
NASDAQ:AMD
348.7B USD
48%
9%
10%
US
Micron Technology Inc
NASDAQ:MU
311.1B USD
45%
32%
28%
KR
SK Hynix Inc
KRX:000660
403.2T KRW
55%
43%
42%
US
Qualcomm Inc
NASDAQ:QCOM
187.7B USD
55%
28%
13%
US
Texas Instruments Inc
NASDAQ:TXN
161B USD
57%
35%
29%
US
Analog Devices Inc
NASDAQ:ADI
135.5B USD
61%
27%
21%
UK
Arm Holdings PLC
NASDAQ:ARM
118.9B USD
97%
20%
19%
No Stocks Found

Return on Capital

Return on capital ratios give a sense of how well a company is using its capital (equity, assets, capital employed, etc.) to generate profits (operating income, net income, etc.). In simple words, these ratios show how much income is generated for each dollar of capital invested.

Show More Less

Return on Capital Comparison
Intel Corp Competitors

Country Company Market Cap ROE ROA ROCE ROIC
US
Intel Corp
NASDAQ:INTC
173.2B USD
0%
0%
0%
0%
US
NVIDIA Corp
NASDAQ:NVDA
4.6T USD
112%
81%
107%
136%
US
Broadcom Inc
NASDAQ:AVGO
1.7T USD
31%
14%
17%
17%
TW
Taiwan Semiconductor Manufacturing Co Ltd
TWSE:2330
38.8T TWD
35%
23%
32%
36%
US
Advanced Micro Devices Inc
NASDAQ:AMD
348.7B USD
6%
5%
4%
5%
US
Micron Technology Inc
NASDAQ:MU
311.1B USD
23%
15%
20%
18%
KR
SK Hynix Inc
KRX:000660
403.2T KRW
43%
28%
35%
29%
US
Qualcomm Inc
NASDAQ:QCOM
187.7B USD
24%
11%
30%
15%
US
Texas Instruments Inc
NASDAQ:TXN
161B USD
30%
14%
19%
19%
US
Analog Devices Inc
NASDAQ:ADI
135.5B USD
7%
5%
7%
6%
UK
Arm Holdings PLC
NASDAQ:ARM
118.9B USD
12%
9%
11%
14%
No Stocks Found

Free Cash Flow

Free cash flow (FCF) is the money a company has left over after paying its operating expenses and capital expenditures. The more free cash flow a company has, the more it can allocate to dividends, paying down debt, and growth opportunities.

If a company has a decreasing free cash flow, that is not necessarily bad if the company is investing in its growth.

Show More Less