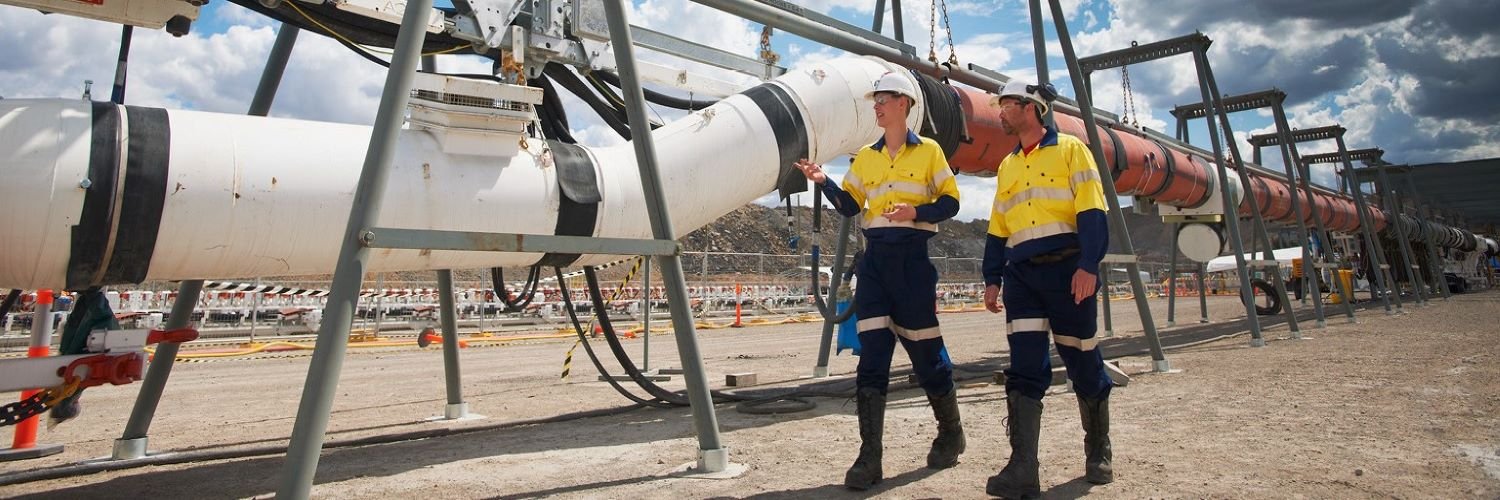
Glencore PLC
F:8GCA

Decide at what price you'd be comfortable buying and we'll help you stay ready.
|
G
|
Glencore PLC
F:8GCA
|
CH |

|
Rollins Inc
NYSE:ROL
|
US |
|
|
Phoenix New Media Ltd
F:1PX
|
CN |
|
C
|
Campbell Soup Co
SWB:CSC
|
US |
|
C
|
Charles Schwab Corp
DUS:SWG
|
US |
|
Tikehau Capital SCA
OTC:TKKHF
|
FR |

|
Independence Realty Trust Inc
F:5O2
|
US |

|
Exlservice Holdings Inc
NASDAQ:EXLS
|
US |

|
Almonty Industries Inc
F:ALI1
|
CA |
|
J
|
Julius Baer Gruppe AG
F:JGE1
|
CH |

|
Wesfarmers Ltd
ASX:WES
|
AU |

|
Credito Emiliano SpA
OTC:CDEFF
|
IT |
|
F
|
Firstsun Capital Bancorp
NASDAQ:FSUN
|
US |

|
Resmed Inc
F:RMEA
|
US |

|
Truist Financial Corp
NYSE:TFC
|
US |
|
B
|
Bank of Communications Co Ltd
XMUN:C4C
|
CN |
|
B
|
Bialetti Industrie SpA
SWB:32B
|
IT |
|
F
|
Fastenal Co
XMUN:FAS
|
US |
|
B
|
Bristol-Myers Squibb Co
SWB:BRM
|
US |

|
Kingfisher PLC
F:KFI2
|
UK |
|
C
|
CLEANTEK Industries Inc
XTSX:CTEK
|
CA |
Dividends
Dividend Yield
Glencore PLC

| Current Yield | |
| Min Yield | |
| Max Yield | |
| Average Yield | |
| Median Yield |
Dividend Per Share
Glencore PLC
8GCA have increased by 158%.
Payout Ratio
Glencore PLC
Peers Comparison
Dividends
Shareholder Yield
Current shareholder yield for 8GCA is
hidden
.
Peers Comparison
Shareholder Yield
Buybacks
Buyback Yield measures how much a company reduces its outstanding shares through repurchases, expressed as a percentage.
This metric directly reflects the company’s efforts to return value to shareholders. By reducing the number of shares, buybacks can increase earnings per share and potentially boost the stock's price.

Peers Comparison
Buybacks
Debt Paydown
Debt Paydown Yield measures the amount of debt a company repays within a specific period, shown as a percentage of its market capitalization.
This metric indicates how the company is using its capital to decrease financial liabilities, which can strengthen its financial health and potentially enhance shareholder value.
Peers Comparison
Debt Paydown
Price Appreciation
8GCA Price
Glencore PLC
| Average Annual Return | 9.89% |
| Standard Deviation of Annual Returns | 29.82% |
| Max Drawdown | -59% |
| Market Capitalization | 60.2B EUR |
| Shares Outstanding | 6 077 289 984 |
| Percentage of Shares Shorted |
N/A
|
