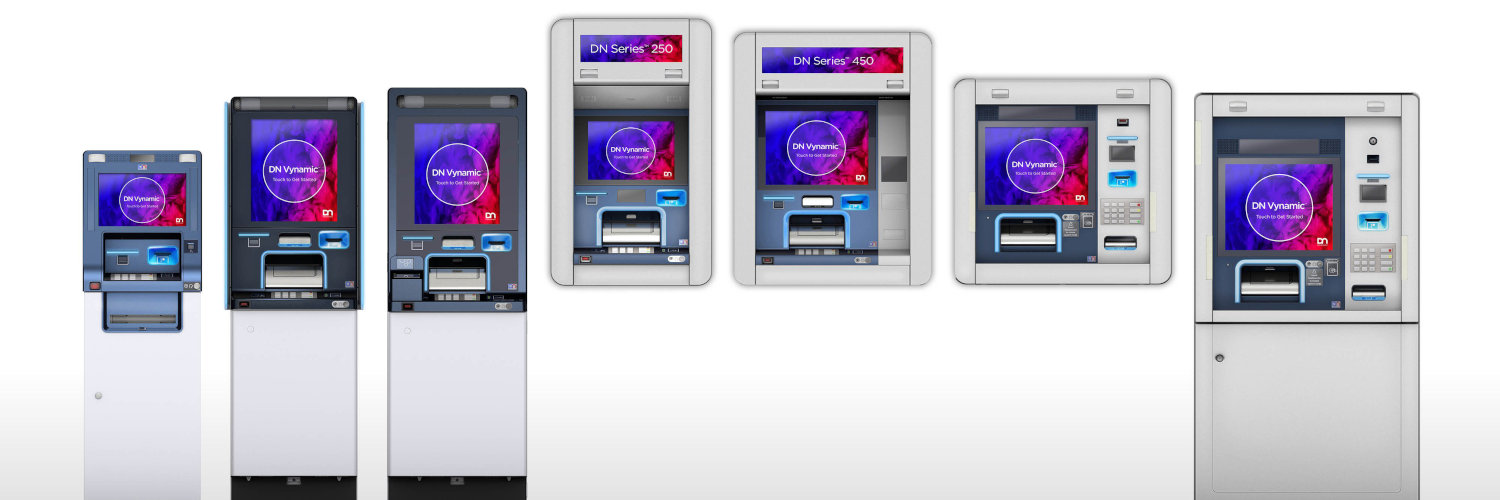

Diebold Nixdorf Inc banner
Financial profile · Q3 FY2026

A stable-scale equipment and services business with improving margins, uneven cash conversion

Across the reported years, revenue has remained at a mature multibillion-dollar scale while operating profitability recovered from weaker periods. Recent annual free cash flow has been positive, but working-capital swings make quarterly cash conversion less smooth than earnings.

What is developing

The latest TTM continued revenue and operating-income expansion, but operating cash flow and free cash flow declined from the prior TTM, and the latest quarter was cash-flow negative amid working-capital and VAT-refund timing effects. TTM free cash flow remained positive, making this a meaningful cash-conversion setback to monitor rather than clear evidence of a changed business model.

What matters next

Whether working-capital outflows reverse enough for operating cash flow to support free cash flow in subsequent reporting periods.

USD
Metric FY2020 FY2021 FY2022 FY2023 FY2024 FY2025
(267.8m) (78.1m) (585.6m) 1.4B (14.5m) 97.5m
180.4m 149.1m 126m 136.3m 132.3m 127.5m
(27.1m) (12.6m) 92.9m 36.6m (34.1m) (48.1m)
14.9m 13.8m 13.4m 5.2m 9.7m 12.1m
134.2m 10.1m 148.8m (1.6B) 21.6m 58m
43.8m 42.3m 33.1m 46.6m 56.1m 57.2m
138.1m 175.1m 231.6m 127.4m 149.4m 59.1m
92.8m 54.4m (169.7m) (203.8m) 43.9m 65.8m
112.5m 122.9m (387.6m) (254.2m) 149.2m 300.7m
(27.5m) (20.2m) (24.4m) (24.9m) (17.4m) (37.4m)
(55.1m) (29m) 600k (11.2m) (28.1m) (60.2m)
(82.6m) (49.2m) (23.8m) (36.1m) (45.5m) (97.6m)
(6.6m) — — — — (130.7m)
118m (7.3m) 376.1m 661.3m (300.1m) 0
0 — — — — —
(94.5m) 3.7m (26.3m) (101.8m) (66.4m) (13.2m)
16.9m (3.6m) 349.8m 559.5m (366.5m) (143.9m)
(3.2m) (5.7m) (8.2m) 4m (18.2m) 16.8m
43.6m 64.4m (69.8m) 273.2m (281m) 76m
85m 102.7m (412m) (279.1m) 131.8m 263.3m