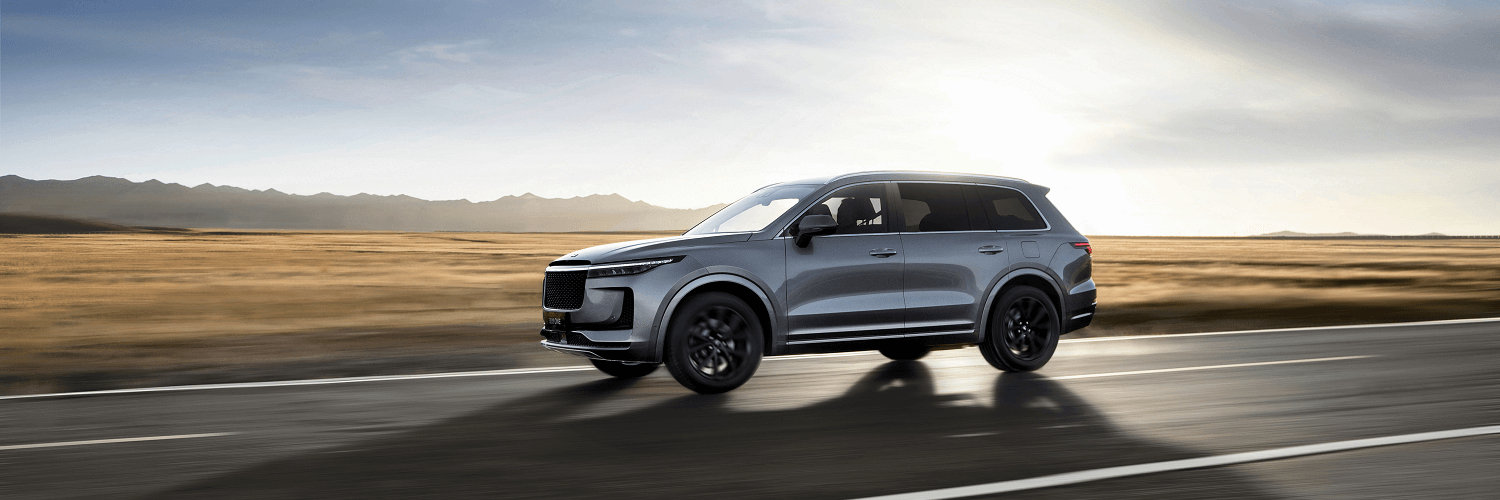

Li Auto Inc
HKEX:2015

Decide at what price you'd be comfortable buying and we'll help you stay ready.

|
Johnson & Johnson
NYSE:JNJ
|
US |

|
Berkshire Hathaway Inc
NYSE:BRK.A
|
US |

|
Bank of America Corp
NYSE:BAC
|
US |

|
Mastercard Inc
NYSE:MA
|
US |

|
UnitedHealth Group Inc
NYSE:UNH
|
US |

|
Exxon Mobil Corp
NYSE:XOM
|
US |

|
Pfizer Inc
NYSE:PFE
|
US |

|
Nike Inc
NYSE:NKE
|
US |

|
Visa Inc
NYSE:V
|
US |

|
Alibaba Group Holding Ltd
NYSE:BABA
|
CN |

|
JPMorgan Chase & Co
NYSE:JPM
|
US |

|
Coca-Cola Co
NYSE:KO
|
US |

|
Verizon Communications Inc
NYSE:VZ
|
US |

|
Chevron Corp
NYSE:CVX
|
US |

|
Walt Disney Co
NYSE:DIS
|
US |

|
PayPal Holdings Inc
NASDAQ:PYPL
|
US |
 Li Auto Inc
Total Current Assets
Li Auto Inc
Total Current Assets
Li Auto Inc
Total Current Assets Peer Comparison
Competitors Analysis
Latest Figures & CAGR of Competitors
| Company | Total Current Assets | CAGR 3Y | CAGR 5Y | CAGR 10Y | ||
|---|---|---|---|---|---|---|
|
|
Li Auto Inc
HKEX:2015
|
Total Current Assets
¥115.3B
|
CAGR 3-Years
20%
|
CAGR 5-Years
30%
|
CAGR 10-Years
N/A
|
|

|
Great Wall Motor Co Ltd
SSE:601633
|
Total Current Assets
¥137.6B
|
CAGR 3-Years
9%
|
CAGR 5-Years
7%
|
CAGR 10-Years
13%
|
|

|
BYD Co Ltd
SZSE:002594
|
Total Current Assets
¥371.5B
|
CAGR 3-Years
16%
|
CAGR 5-Years
27%
|
CAGR 10-Years
21%
|
|

|
Seres Group Co Ltd
SSE:601127
|
Total Current Assets
¥98.8B
|
CAGR 3-Years
54%
|
CAGR 5-Years
59%
|
CAGR 10-Years
N/A
|
|
|
SAIC Motor Corp Ltd
SSE:600104
|
Total Current Assets
¥623B
|
CAGR 3-Years
2%
|
CAGR 5-Years
2%
|
CAGR 10-Years
9%
|
|
|
C
|
Chery Automobile Co Ltd
HKEX:9973
|
Total Current Assets
¥190.6B
|
CAGR 3-Years
30%
|
CAGR 5-Years
N/A
|
CAGR 10-Years
N/A
|
|
Li Auto Inc
Glance View
In the bustling landscape of China's automotive sector, Li Auto Inc. has carved out a distinctive niche by pioneering the development and sale of electric vehicles. Founded by Li Xiang, the company has emerged as one of the prominent players in the Chinese EV market, channeling its focus on extended-range electric vehicles (EREVs). Li Auto's strategic commitment to EREVs capitalizes on existing infrastructure, offering consumers an eclectic mix of electric efficiency and the reassurance of a gasoline-powered generator for extended drives. This innovative approach addresses range anxiety, a persistent concern among EV customers, making the company's vehicles particularly appealing to those navigating China's expansive geography. Li Auto generates revenue primarily through vehicle sales, leveraging the allure of its hybrid technology to capture a broad customer base seeking reliability and innovation. Instead of venturing into aggressively futuristic designs, Li Auto has maintained a pragmatic approach, ensuring its vehicles cater to family-oriented needs by prioritizing space and utility. With each model launch, the company strengthens its value proposition, integrating smart technology and functionality to enhance the driving experience. Moreover, Li Auto's business model extends beyond vehicle sales, tapping into the potential of complementary services such as autonomous driving features and smart energy solutions, setting the stage for continued growth in a rapidly evolving market.
See Also
What is Li Auto Inc's Total Current Assets?
Total Current Assets
115.3B
CNY
Based on the financial report for Dec 31, 2025, Li Auto Inc's Total Current Assets amounts to 115.3B CNY.
What is Li Auto Inc's Total Current Assets growth rate?
Total Current Assets CAGR 5Y
30%
Over the last year, the Total Current Assets growth was -9%. The average annual Total Current Assets growth rates for Li Auto Inc have been 20% over the past three years , 30% over the past five years .
