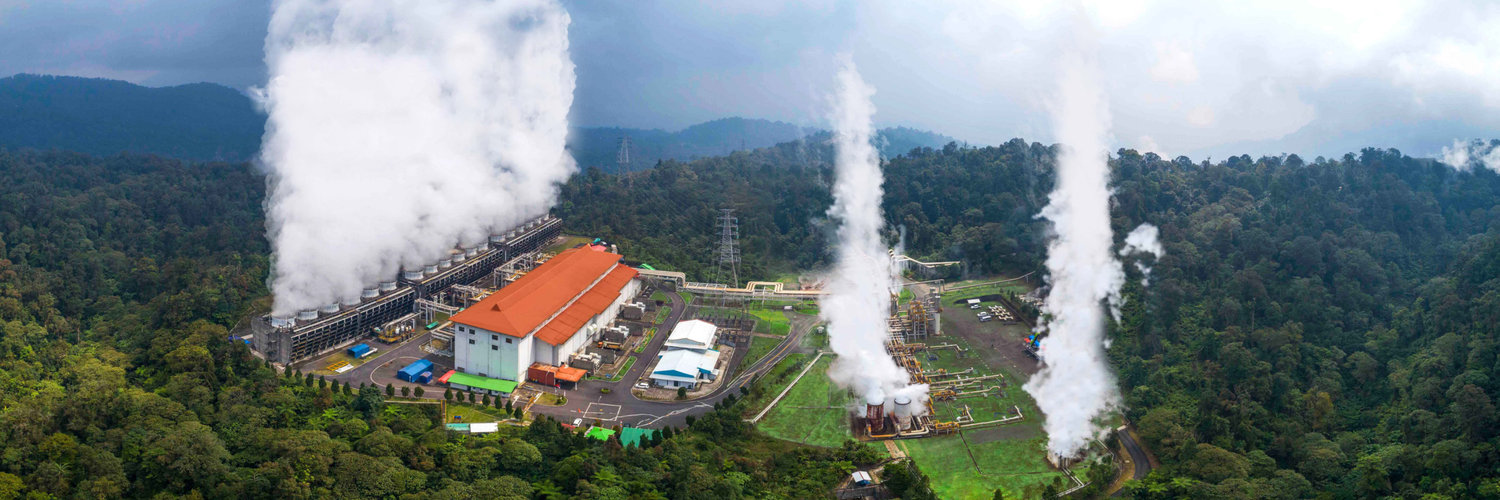
Barito Renewables Energy PT Tbk
IDX:BREN

Decide at what price you'd be comfortable buying and we'll help you stay ready.
|
B
|
Barito Renewables Energy PT Tbk
IDX:BREN
|
ID |

|
Yara International ASA
LSE:0O7D
|
NO |
|
I
|
Intuitive Surgical Inc
XMUN:IUI1
|
US |
|
A
|
Allstate Corp
F:ALS
|
US |
|
W
|
West Fraser Timber Co Ltd
XMUN:WFC
|
CA |

|
Dufry AG
F:D2J
|
CH |
|
S
|
Starbucks Corp
XMUN:SRB
|
US |
|
N
|
NVE Corp
XMUN:NVK
|
US |

|
PCI- PAL PLC
F:FVA
|
UK |
Intrinsic Value
The intrinsic value for Barito Renewables Energy PT Tbk (BREN) under the Base Case is hidden IDR. Compared with the current market price of 3 340 IDR, the stock appears hidden .
BREN looks overvalued. Yet it might still be cheap by its own standards. Some stocks live permanently above intrinsic value; Historical Valuation reveals whether BREN usually does or if today's premium is unusual.
Learn how current stock valuations stack up against historical averages to gauge true investment potential.

Let our AI compare Alpha Spread’s intrinsic value with external valuations from Simply Wall St, GuruFocus, ValueInvesting.io, Seeking Alpha, and others.
Let our AI break down the key assumptions behind the intrinsic value calculation for Barito Renewables Energy PT Tbk.

The intrinsic value for Barito Renewables Energy PT Tbk (BREN) under the Base Case is hidden IDR.
Compared with the current market price of 3 340 IDR, the stock appears hidden.
