Keurig Dr Pepper Inc
NASDAQ:KDP
Gross Margin
Gross Margin shows how much money a company keeps from each dollar of sales after paying for the products it sells. It tells how profitable the company`s core business is before other expenses.
Gross Margin shows how much money a company keeps from each dollar of sales after paying for the products it sells. It tells how profitable the company`s core business is before other expenses.
Peer Comparison
| Country | Company | Market Cap |
Gross Margin |
||
|---|---|---|---|---|---|
| US |

|
Keurig Dr Pepper Inc
NASDAQ:KDP
|
41.1B USD |
Loading...
|
|
| US |

|
Coca-Cola Co
NYSE:KO
|
350.2B USD |
Loading...
|
|
| US |

|
PepsiCo Inc
NASDAQ:PEP
|
231.9B USD |
Loading...
|
|
| MX |

|
Fomento Economico Mexicano SAB de CV
NYSE:FMX
|
202B USD |
Loading...
|
|
| US |

|
Monster Beverage Corp
NASDAQ:MNST
|
83.9B USD |
Loading...
|
|
| CN |

|
Nongfu Spring Co Ltd
HKEX:9633
|
524.8B HKD |
Loading...
|
|
| UK |

|
Coca-Cola Europacific Partners PLC
NASDAQ:CCEP
|
49.7B USD |
Loading...
|
|
| CH |

|
Coca Cola HBC AG
LSE:CCH
|
17.5B GBP |
Loading...
|
|
| MX |

|
Coca-Cola Femsa SAB de CV
NYSE:KOF
|
23.4B USD |
Loading...
|
|
| MX |

|
Arca Continental SAB de CV
BMV:AC
|
352B MXN |
Loading...
|
|
| CN |

|
Eastroc Beverage Group Co Ltd
SSE:605499
|
127.8B CNY |
Loading...
|
Market Distribution
| Min | -24 813% |
| 30th Percentile | 28.9% |
| Median | 43% |
| 70th Percentile | 60.5% |
| Max | 10 905 714.3% |
Other Profitability Ratios
Keurig Dr Pepper Inc
Glance View
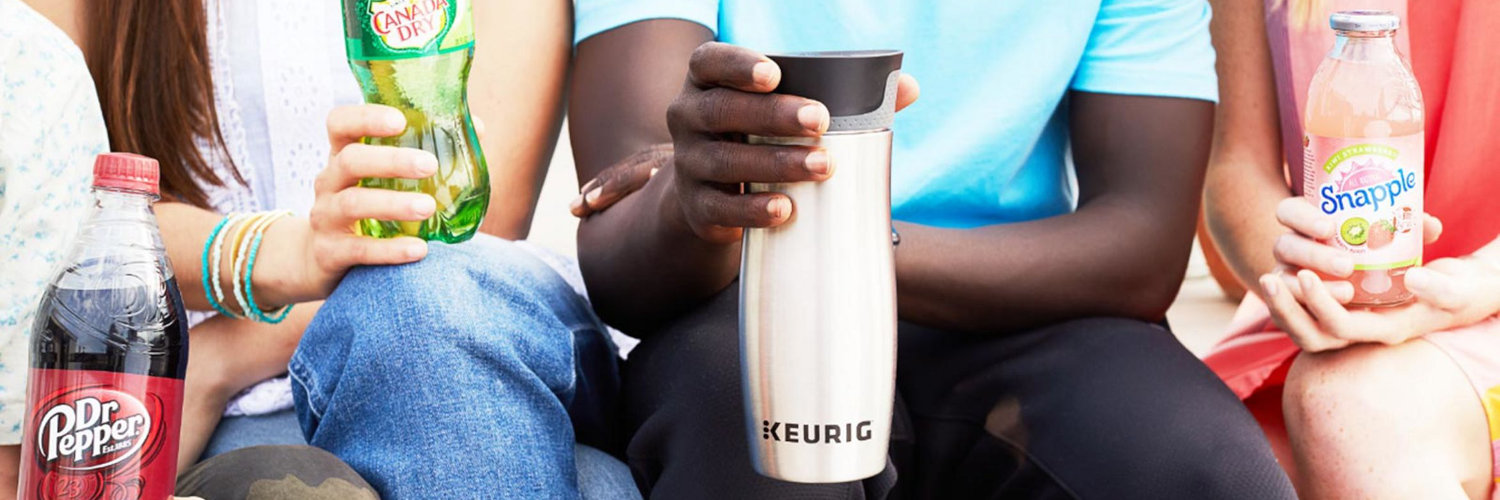
Keurig Dr Pepper Inc. stands as a unique powerhouse in the beverage industry, blending the robust traditions of its predecessors with innovative approaches to consumer needs. Born from the merger of Keurig Green Mountain and Dr Pepper Snapple Group, the company cleverly straddles two distinct market segments: hot and cold beverages. This dual nature is a strategic asset that sets it apart in an industry swarming with competition. On one side, Keurig dominates the single-serve coffee market with its proprietary brewing systems and an extensive variety of coffee pods, catering to the convenience-seeking, coffee-loving consumer. On the other, Dr Pepper Snapple holds an impressive portfolio of over 125 brands, including household names like Dr Pepper, 7UP, and Snapple, offering an array of carbonated drinks, juices, and mixers that capture a broad audience. The revenue engines for Keurig Dr Pepper are fueled by relentless innovation and consumer-centric strategies. From its subscription-based coffee delivery model to dynamic partnerships with brands like Starbucks, the company has capitalized on evolving consumer preferences for personalized and premium experiences. In parallel, the cold beverage segment expands through well-executed marketing campaigns and strategic acquisitions, which bolster shelf presence and brand loyalty in various retail channels. By integrating these Diverse elements, Keurig Dr Pepper not only navigates the competitive landscape effectively but also secures a solid foothold across multiple beverage categories, ensuring a steady flow of profit streams from both in-home coffee enthusiasts and on-the-go beverage consumers.
See Also
Gross Margin is calculated by dividing the Gross Profit by the Revenue.
The current Gross Margin for Keurig Dr Pepper Inc is 54.8%, which is above its 3-year median of 54.5%.
Over the last 3 years, Keurig Dr Pepper Inc’s Gross Margin has increased from 52.1% to 54.8%. During this period, it reached a low of 51.8% on Mar 31, 2023 and a high of 55.8% on Jun 30, 2024.
