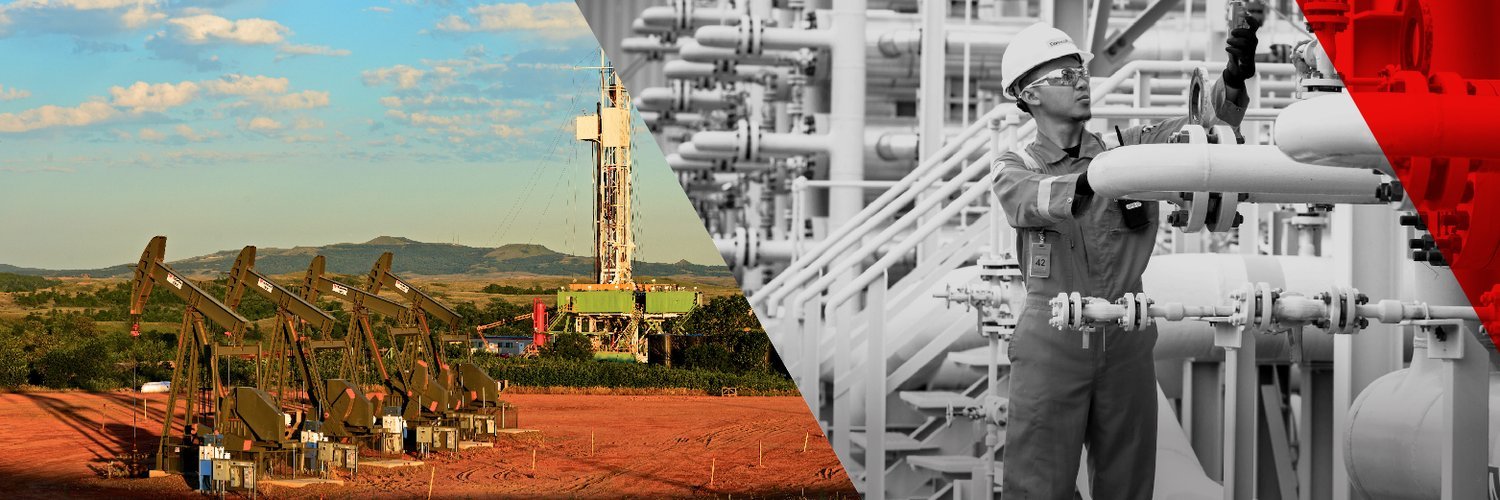
Conocophillips banner

Conocophillips
NYSE:COP

Watchlist Manager
Conocophillips Logo
Conocophillips
NYSE:COP
Watchlist
Price: 130.52 USD 1.67% Market Closed
Market Cap: $159.5B

Profitability Summary

Conocophillips's profitability score is hidden . We take all the information about a company's profitability (such as its margins, capital efficiency, free cash flow generating ability, and more) and consolidate it into one single number - the profitability score. The higher the profitability score, the more profitable the company is.

Sign Up to see
Profitability Score
Sign In
Sign Up

We take all the information about a company's profitability (such as its margins, capital efficiency, free cash flow generating ability, and more) and consolidate it into one single number - the profitability score. The higher the profitability score, the more profitable the company is.

We take all the information about a company's profitability (such as its margins, capital efficiency, free cash flow generating ability, and more) and consolidate it into one single number - the profitability score. The higher the profitability score, the more profitable the company is.

Sign Up to see
Profitability Score
Sign In
Sign Up

Margins

Earnings Waterfall
Conocophillips

Margins Comparison
Conocophillips Competitors

Country Company Market Cap Gross
Margin
Operating
Margin
Net
Margin
US
Conocophillips
NYSE:COP
159.9B USD
Loading...
Loading...
Loading...
SA
Saudi Arabian Oil Co
SAU:2222
6.7T SAR
Loading...
Loading...
Loading...
US
Exxon Mobil Corp
NYSE:XOM
671.5B USD
Loading...
Loading...
Loading...
US
Chevron Corp
NYSE:CVX
396.8B USD
Loading...
Loading...
Loading...
NL
Royal Dutch Shell PLC
OTC:RYDAF
288.2B USD
Loading...
Loading...
Loading...
NO
Equinor ASA
OSE:EQNR
998.1B NOK
Loading...
Loading...
Loading...
CA
Canadian Natural Resources Ltd
TSX:CNQ
137.7B CAD
Loading...
Loading...
Loading...
US
EOG Resources Inc
NYSE:EOG
76.7B USD
Loading...
Loading...
Loading...
CN
CNOOC Ltd
SSE:600938
1.1T CNY
Loading...
Loading...
Loading...
PK
Oil and Gas Development Co Ltd
LSE:37OC
59.6B USD
Loading...
Loading...
Loading...
US
Diamondback Energy Inc
NASDAQ:FANG
55.2B USD
Loading...
Loading...
Loading...

Return on Capital

Return on Capital Comparison
Conocophillips Competitors

Country Company Market Cap ROE ROA ROCE ROIC
US
Conocophillips
NYSE:COP
159.9B USD
Loading...
Loading...
Loading...
Loading...
SA
Saudi Arabian Oil Co
SAU:2222
6.7T SAR
Loading...
Loading...
Loading...
Loading...
US
Exxon Mobil Corp
NYSE:XOM
671.5B USD
Loading...
Loading...
Loading...
Loading...
US
Chevron Corp
NYSE:CVX
396.8B USD
Loading...
Loading...
Loading...
Loading...
NL
Royal Dutch Shell PLC
OTC:RYDAF
288.2B USD
Loading...
Loading...
Loading...
Loading...
NO
Equinor ASA
OSE:EQNR
998.1B NOK
Loading...
Loading...
Loading...
Loading...
CA
Canadian Natural Resources Ltd
TSX:CNQ
137.7B CAD
Loading...
Loading...
Loading...
Loading...
US
EOG Resources Inc
NYSE:EOG
76.7B USD
Loading...
Loading...
Loading...
Loading...
CN
CNOOC Ltd
SSE:600938
1.1T CNY
Loading...
Loading...
Loading...
Loading...
PK
Oil and Gas Development Co Ltd
LSE:37OC
59.6B USD
Loading...
Loading...
Loading...
Loading...
US
Diamondback Energy Inc
NASDAQ:FANG
55.2B USD
Loading...
Loading...
Loading...
Loading...

Free Cash Flow

Free Cash Flow Analysis
Conocophillips

Last Value
3-Years Average
FCF Margin
Conversion Rate
Get AI-powered insights for any company or topic.
Open AI Assistant

Intrinsic Value is all-important and is the only logical way to evaluate the relative attractiveness of investments and businesses.

Warren Buffett