Desktop Metal Inc
NYSE:DM

Decide at what price you'd be comfortable buying and we'll help you stay ready.
|
D
|
D-Wave Quantum Inc
NYSE:QBTS
|
CA |
|
T
|
Tirupati Forge Ltd
NSE:TIRUPATIFL
|
IN |
 Desktop Metal Inc
Depreciation & Amortization
Desktop Metal Inc
Depreciation & Amortization
Desktop Metal Inc
Depreciation & Amortization Peer Comparison
Competitors Analysis
Latest Figures & CAGR of Competitors
| Company | Depreciation & Amortization | CAGR 3Y | CAGR 5Y | CAGR 10Y | ||
|---|---|---|---|---|---|---|
|
|
Desktop Metal Inc
NYSE:DM
|
Depreciation & Amortization
-$13.8m
|
CAGR 3-Years
N/A
|
CAGR 5-Years
N/A
|
CAGR 10-Years
N/A
|
|

|
Otis Worldwide Corp
NYSE:OTIS
|
Depreciation & Amortization
N/A
|
CAGR 3-Years
N/A
|
CAGR 5-Years
N/A
|
CAGR 10-Years
N/A
|
|

|
Ingersoll Rand Inc
NYSE:IR
|
Depreciation & Amortization
-$387.5m
|
CAGR 3-Years
-4%
|
CAGR 5-Years
-3%
|
CAGR 10-Years
N/A
|
|

|
Parker-Hannifin Corp
NYSE:PH
|
Depreciation & Amortization
N/A
|
CAGR 3-Years
N/A
|
CAGR 5-Years
N/A
|
CAGR 10-Years
N/A
|
|

|
Barnes Group Inc
NYSE:B
|
Depreciation & Amortization
N/A
|
CAGR 3-Years
N/A
|
CAGR 5-Years
N/A
|
CAGR 10-Years
N/A
|
|

|
Illinois Tool Works Inc
NYSE:ITW
|
Depreciation & Amortization
-$80m
|
CAGR 3-Years
16%
|
CAGR 5-Years
12%
|
CAGR 10-Years
10%
|
|
Desktop Metal Inc
Glance View
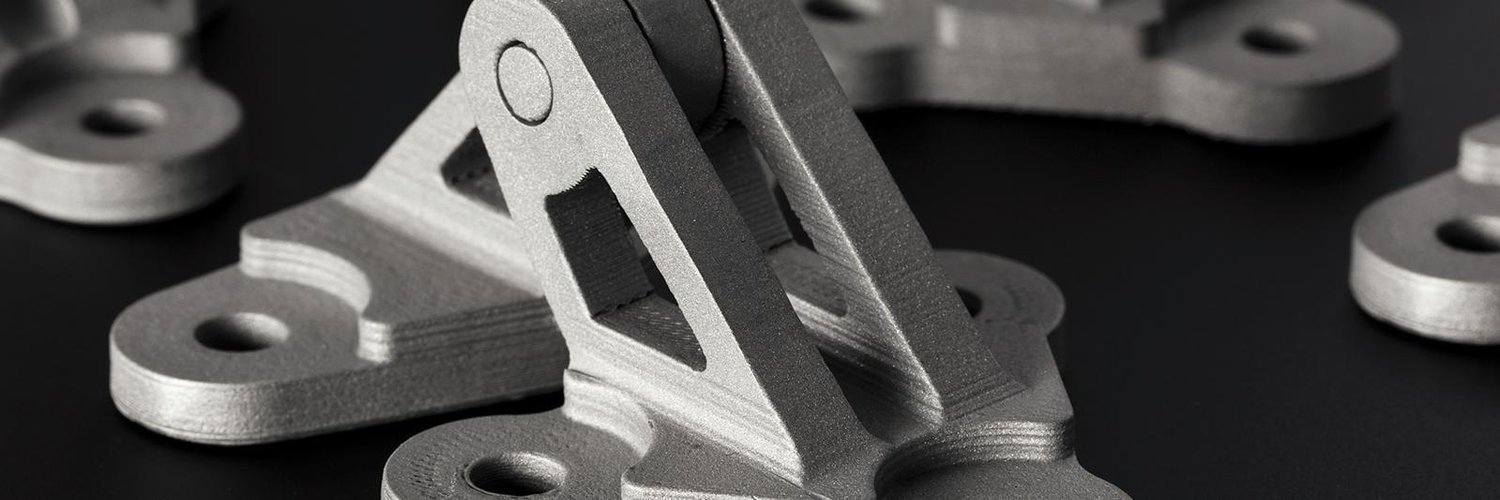
Desktop Metal, Inc. engages in the manufacture of additive manufacturing solutions accessible to engineering, design, and manufacturing applications. The company is headquartered in Burlington, Massachusetts and currently employs 1,370 full-time employees. The company went IPO on 2019-03-15. The firm offer a portfolio of integrated additive manufacturing solutions comprised of hardware, software, materials and services with support for metals, polymers, elastomers, ceramics, sands, composites, wood and biocompatible materials. Its product platforms include metal additive manufacturing systems, include production system, shop system platform, X-series platform and studio system platform; photopolymer additive manufacturing systems, which includes Xtreme 8K platform, Einstein series, P4K platform, envision one platform and D4K pro platform; digital casting additive manufacturing systems, which includes S-Max platform, robotic additive manufacturing (RAM) platform and S-Print; composite additive manufacturing systems, which includes fiber platform, and bio fabrication additive manufacturing systems, which includes three-dimensional (3D)-bio plotter platform.
See Also
What is Desktop Metal Inc's Depreciation & Amortization?
Depreciation & Amortization
-13.8m
USD
Based on the financial report for Dec 31, 2023, Desktop Metal Inc's Depreciation & Amortization amounts to -13.8m USD.
What is Desktop Metal Inc's Depreciation & Amortization growth rate?
Depreciation & Amortization CAGR 1Y
8%
Over the last year, the Depreciation & Amortization growth was 8%.
