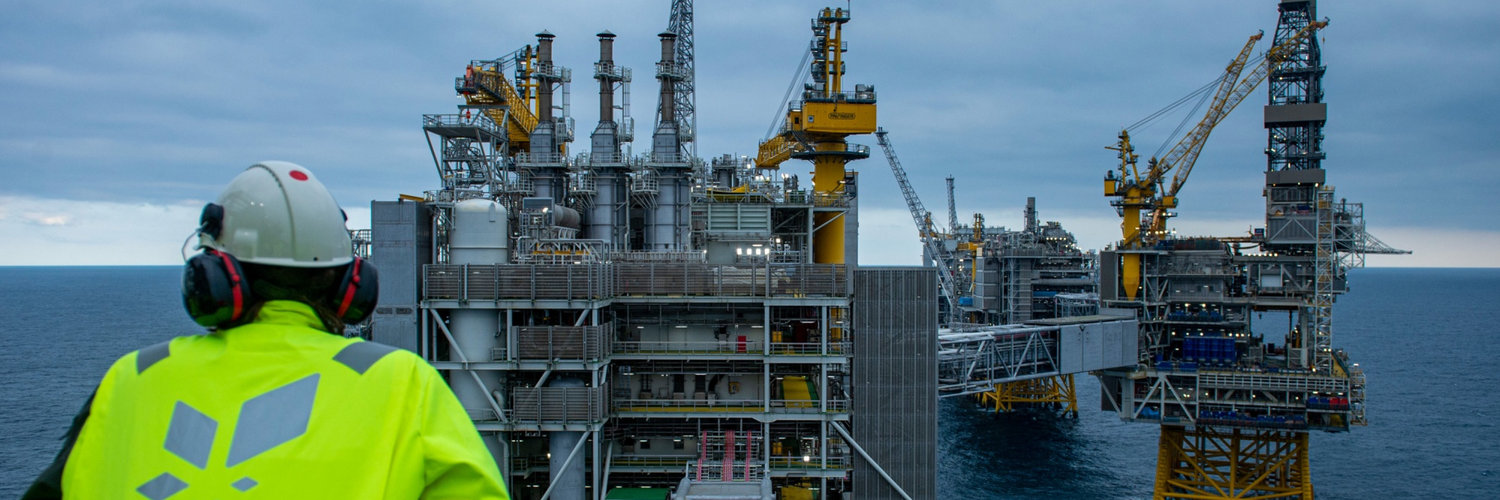

Equinor ASA
NYSE:EQNR

Decide at what price you'd be comfortable buying and we'll help you stay ready.

|
Equinor ASA
NYSE:EQNR
|
NO |
|
A
|
Accenture PLC
SWB:CSA
|
IE |

|
AIA Group Ltd
HKEX:1299
|
HK |

|
Xpel Inc
F:XPX
|
US |

|
Balchem Corp
NASDAQ:BCPC
|
US |

|
Bendigo and Adelaide Bank Ltd
ASX:BEN
|
AU |
|
A
|
Avery Dennison Corp
DUS:AV3
|
US |
|
D
|
DTE Energy Co
SWB:DGY
|
US |
|
G
|
Garmin Ltd
XBER:GEY
|
CH |

|
SKF AB
OTC:SKUFF
|
SE |
|
M
|
Motorola Solutions Inc
SWB:MTLA
|
US |

|
Affirm Holdings Inc
NASDAQ:AFRM
|
US |
|
D
|
Dowlais Group Plc
LSE:DWL
|
UK |
|
L
|
LEG Immobilien SE
DUS:LEG
|
DE |
|
T
|
TD Synnex Corp
SWB:SUX
|
US |
|
D
|
Delivery Hero SE
OTC:DELHY
|
DE |

|
Zumtobel Group AG
OTC:ZMTBY
|
AT |

|
Ionis Pharmaceuticals Inc
NASDAQ:IONS
|
US |

|
Global Hemp Group Inc
F:GHG
|
CA |
Profitability Summary
Equinor ASA's profitability score is Hidden . We take all the information about a company's profitability, such as its margins, capital efficiency, free cash flow generating ability, and more, and consolidate it into one single number: the profitability score. The higher the profitability score, the more profitable the company is.
Profitability Score
We take all the information about a company's profitability, such as its margins, capital efficiency, free cash flow generating ability, and more, and consolidate it into one single number: the profitability score. The higher the profitability score, the more profitable the company is.
We take all the information about a company's profitability, such as its margins, capital efficiency, free cash flow generating ability, and more, and consolidate it into one single number: the profitability score. The higher the profitability score, the more profitable the company is.
Profitability Score

