Ingersoll Rand Inc
NYSE:IR

Decide at what price you'd be comfortable buying and we'll help you stay ready.

|
Johnson & Johnson
NYSE:JNJ
|
US |

|
Berkshire Hathaway Inc
NYSE:BRK.A
|
US |

|
Bank of America Corp
NYSE:BAC
|
US |

|
Mastercard Inc
NYSE:MA
|
US |

|
UnitedHealth Group Inc
NYSE:UNH
|
US |

|
Exxon Mobil Corp
NYSE:XOM
|
US |

|
Pfizer Inc
NYSE:PFE
|
US |

|
Nike Inc
NYSE:NKE
|
US |

|
Visa Inc
NYSE:V
|
US |

|
Alibaba Group Holding Ltd
NYSE:BABA
|
CN |

|
JPMorgan Chase & Co
NYSE:JPM
|
US |

|
Coca-Cola Co
NYSE:KO
|
US |

|
Verizon Communications Inc
NYSE:VZ
|
US |

|
Chevron Corp
NYSE:CVX
|
US |

|
Walt Disney Co
NYSE:DIS
|
US |

|
PayPal Holdings Inc
NASDAQ:PYPL
|
US |
EV/EBIT
Enterprise Value to EBIT (EV/EBIT) ratio compares a company`s total enterprise value to its earnings before interest and taxes. It shows how much investors are paying for each dollar of the company`s earnings, including both equity and debt.
Enterprise Value to EBIT (EV/EBIT) ratio compares a company`s total enterprise value to its earnings before interest and taxes. It shows how much investors are paying for each dollar of the company`s earnings, including both equity and debt.
Valuation Scenarios
If EV/EBIT returns to its 3-Year Average (26.7), the stock would be worth $93.67 (12% upside from current price).
| Scenario | EV/EBIT Value | Implied Price | Upside/Downside |
|---|---|---|---|
| Current Multiple | 23.9 | $83.81 |
0%
|
| 3-Year Average | 26.7 | $93.67 |
+12%
|
| 5-Year Average | 28.2 | $98.96 |
+18%
|
| Industry Average | 20 | $70.11 |
-16%
|
| Country Average | 19.6 | $68.91 |
-18%
|
Forward EV/EBIT
Today’s price vs future ebit
| Today's Enterprise Value | EBIT | Forward EV/EBIT | ||
|---|---|---|---|---|
|
$40.3B
|
/ |
Jan 2026
$1.5B
|
= |
|
|
$40.3B
|
/ |
Dec 2026
$2B
|
= |
|
|
$40.3B
|
/ |
Dec 2027
$2.1B
|
= |
|
|
$40.3B
|
/ |
Dec 2028
$2.3B
|
= |
|
Forward EV/EBIT shows whether today’s EV/EBIT still looks high or low once future ebit are taken into account.
Peer Comparison
| Market Cap | EV/EBIT | P/E | ||||
|---|---|---|---|---|---|---|
| US |

|
Ingersoll Rand Inc
NYSE:IR
|
32.8B USD | 23.9 | 56.4 | |
| JP |
F
|
Fujitec Co Ltd
TSE:6406
|
2 720 795.8T JPY | 15.8 | 0 | |
| JP |
I
|
Ishii Iron Works Co Ltd
TSE:6362
|
304.2T JPY | 210 169.2 | 363 670.8 | |
| JP |
S
|
Star Micronics Co Ltd
TSE:7718
|
48T JPY | 13.1 | 29.8 | |
| US |

|
Parker-Hannifin Corp
NYSE:PH
|
123B USD | 29.5 | 34.8 | |
| JP |

|
Freund Corp
TSE:6312
|
16.9T JPY | 5 768.3 | 8 494.3 | |
| JP |

|
Mitsubishi Heavy Industries Ltd
TSE:7011
|
15.9T JPY | 40.5 | 56.7 | |
| SE |

|
Atlas Copco AB
STO:ATCO A
|
915.4B SEK | 26.4 | 34.6 | |
| US |

|
Illinois Tool Works Inc
NYSE:ITW
|
77.7B USD | 20 | 25.3 | |
| US |

|
Barnes Group Inc
NYSE:B
|
68.8B USD | 8.3 | 13.7 | |
| SE |

|
Sandvik AB
STO:SAND
|
496.6B SEK | 24.2 | 33.8 |
Market Distribution
| Min | 0 |
| 30th Percentile | 13.6 |
| Median | 19.6 |
| 70th Percentile | 27.8 |
| Max | 1 826 183.2 |
Other Multiples
Ingersoll Rand Inc
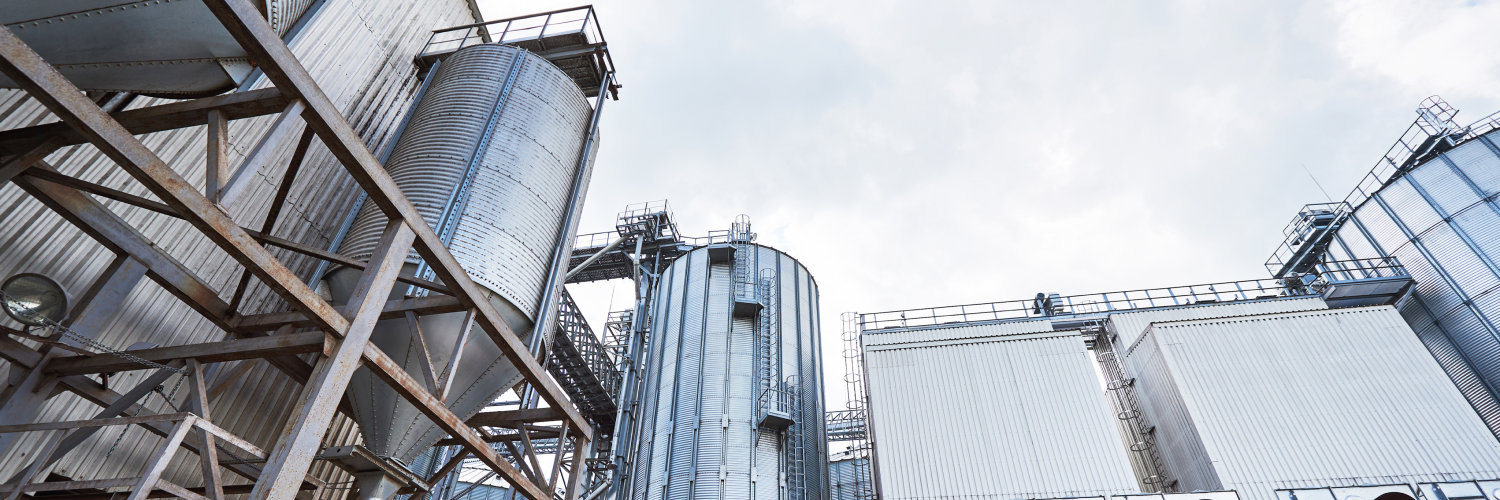
Glance View
Ingersoll Rand Inc., a name that resonates with industrial ingenuity, stands as a testament to the transformative power of innovation. Originally founded in 1871, the company's story is one steeped in a heritage of merging expertise and engineering prowess to drive industrial efficiency across the globe. Today, Ingersoll Rand has evolved significantly beyond its roots, primarily operating in two business segments: Industrial Technologies and Services, and Precision & Science Technologies. Their operational framework involves creating mission-critical flow creation systems like compressors, pumps, power tools, and fluid and material handling systems. These systems are vital for a myriad of industries, including manufacturing, transportation, and healthcare, showcasing the company's dexterity in addressing diverse industrial needs. The revenue stream for the company primarily flows from designing, manufacturing, and servicing these high-value products, often leading to longstanding customer relationships and repeat business across a global network. At its core, Ingersoll Rand leverages its extensive portfolio of products and solutions to optimize efficiency for its customers, a strategy that has proven adept in cementing its market presence. By continuously investing in research and development, the company ensures its offerings maintain a competitive edge, often integrating advanced technologies such as IoT and AI to enhance functionality and reliability. The emphasis on sustainability and operational excellence not only aids in meeting stringent regulatory requirements but also positions the company as a leader in sustainable industrial solutions. Such strategic initiatives are coupled with a robust aftermarket and service business, which further bolsters revenue by offering clients essential maintenance, repair, and retrofitting services. This dual focus on cutting-edge product innovation and comprehensive service solutions encapsulates how Ingersoll Rand navigates its business landscape, driving growth while making a lasting impact on industries worldwide.
