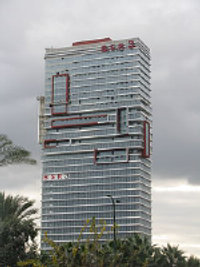
Elbit Imaging Ltd
OTC:EMITF
Elbit Imaging Ltd
OTC:EMITF
Price:
2
USD
Market Cap:
$21.3m

Add Note
Add Target
Capture your thoughts and set a target
Decide at what price you'd be comfortable buying and we'll help you stay ready.
Based on
Margin of Safety
0%
10%
20%
30%
40%
50%
Your Price Target
Linked to
current price
· In Buy Zone
Loading
Note attached
Choose the stock you wish to monitor with a price target
Recently Viewed
|
Elbit Imaging Ltd
OTC:EMITF
|
IL |
|
R
|
Ridley Corporation Ltd
ASX:RIC
|
AU |
|
A
|
AIM Industrial Growth Freehold and Leasehold Real Estate Investment Trust
SET:AIMIRT
|
TH |

|
Daimler AG
XETRA:DAI
|
DE |
Income Statement
Earnings Waterfall
Elbit Imaging Ltd
Elbit Imaging Ltd
Income Statement
Elbit Imaging Ltd
Elbit Imaging Ltd
Currency: ILS
| Jun-2023 | Dec-2023 | Jun-2024 | Dec-2024 | Jun-2025 | Sep-2025 | ||
|---|---|---|---|---|---|---|---|
| Revenue | |||||||
| Revenue |
0
N/A
|
0
N/A
|
0
N/A
|
0
N/A
|
0
N/A
|
24
N/A
|
|
| Gross Profit | |||||||
| Cost of Revenue |
0
|
0
|
0
|
0
|
0
|
(16)
|
|
| Gross Profit |
0
N/A
|
0
N/A
|
0
N/A
|
0
N/A
|
0
N/A
|
8
N/A
|
|
| Operating Income | |||||||
| Operating Expenses |
(1)
|
(9)
|
(3)
|
3
|
(8)
|
(13)
|
|
| Selling, General & Administrative |
(1)
|
(3)
|
(3)
|
(4)
|
(7)
|
(12)
|
|
| Other Operating Expenses |
0
|
(6)
|
1
|
7
|
(1)
|
(1)
|
|
| Operating Income |
(1)
N/A
|
(9)
-950%
|
(3)
+72%
|
3
N/A
|
(8)
N/A
|
(6)
+24%
|
|
| Pre-Tax Income | |||||||
| Interest Income Expense |
(9)
|
(10)
|
0
|
1
|
(0)
|
(4)
|
|
| Non-Reccuring Items |
0
|
2
|
2
|
0
|
0
|
0
|
|
| Total Other Income |
0
|
0
|
0
|
(2)
|
0
|
0
|
|
| Pre-Tax Income |
(10)
N/A
|
(18)
-89%
|
(1)
+96%
|
3
N/A
|
(8)
N/A
|
(10)
-28%
|
|
| Net Income | |||||||
| Tax Provision |
(0)
|
(0)
|
(0)
|
0
|
0
|
0
|
|
| Income from Continuing Operations |
(10)
|
(18)
|
(1)
|
3
|
(8)
|
(10)
|
|
| Income to Minority Interest |
0
|
0
|
0
|
0
|
0
|
0
|
|
| Net Income (Common) |
(10)
N/A
|
(18)
-89%
|
(1)
+96%
|
3
N/A
|
(8)
N/A
|
(10)
-23%
|
|
| EPS (Diluted) |
-1.05
N/A
|
-1.75
-67%
|
-0.08
+95%
|
0.24
N/A
|
-0.73
N/A
|
-0.79
-8%
|
|
Switch to:
Switch to:
See Also
Discover More
