Fanuc Corp
OTC:FANUF

Decide at what price you'd be comfortable buying and we'll help you stay ready.

|
Johnson & Johnson
NYSE:JNJ
|
US |

|
Berkshire Hathaway Inc
NYSE:BRK.A
|
US |

|
Bank of America Corp
NYSE:BAC
|
US |

|
Mastercard Inc
NYSE:MA
|
US |

|
UnitedHealth Group Inc
NYSE:UNH
|
US |

|
Exxon Mobil Corp
NYSE:XOM
|
US |

|
Pfizer Inc
NYSE:PFE
|
US |

|
Nike Inc
NYSE:NKE
|
US |

|
Visa Inc
NYSE:V
|
US |

|
Alibaba Group Holding Ltd
NYSE:BABA
|
CN |

|
JPMorgan Chase & Co
NYSE:JPM
|
US |

|
Coca-Cola Co
NYSE:KO
|
US |

|
Verizon Communications Inc
NYSE:VZ
|
US |

|
Chevron Corp
NYSE:CVX
|
US |

|
Walt Disney Co
NYSE:DIS
|
US |

|
PayPal Holdings Inc
NASDAQ:PYPL
|
US |
EV/GP
Enterprise Value to Gross Profit (EV/GP) ratio compares a company`s total enterprise value to its gross profit. It shows how much investors are paying for each dollar of the company`s gross profit, including both equity and debt.
Enterprise Value to Gross Profit (EV/GP) ratio compares a company`s total enterprise value to its gross profit. It shows how much investors are paying for each dollar of the company`s gross profit, including both equity and debt.
Valuation Scenarios
If EV/GP returns to its 3-Year Average (12.2), the stock would be worth $31.45 (28% downside from current price).
| Scenario | EV/GP Value | Implied Price | Upside/Downside |
|---|---|---|---|
| Current Multiple | 17.1 | $43.91 |
0%
|
| 3-Year Average | 12.2 | $31.45 |
-28%
|
| 5-Year Average | 11.7 | $29.98 |
-32%
|
| Industry Average | 3.8 | $9.84 |
-78%
|
| Country Average | 3.7 | $9.62 |
-78%
|
Forward EV/GP
Today’s price vs future gross profit
Peer Comparison
| Market Cap | EV/GP | P/E | ||||
|---|---|---|---|---|---|---|
| JP |

|
Fanuc Corp
OTC:FANUF
|
6.4T USD | 17.1 | 38.2 | |
| JP |
F
|
Fujitec Co Ltd
TSE:6406
|
2 720 795.8T JPY | 5.6 | 0 | |
| JP |
I
|
Ishii Iron Works Co Ltd
TSE:6362
|
304.2T JPY | 101 236.7 | 363 670.8 | |
| JP |
S
|
Star Micronics Co Ltd
TSE:7718
|
48T JPY | 2.6 | 29.8 | |
| US |

|
Parker-Hannifin Corp
NYSE:PH
|
111.3B USD | 15.5 | 31.5 | |
| JP |

|
Freund Corp
TSE:6312
|
16.9T JPY | 1 767.7 | 8 494.3 | |
| JP |

|
Mitsubishi Heavy Industries Ltd
TSE:7011
|
15.4T JPY | 15.4 | 54.9 | |
| SE |

|
Atlas Copco AB
STO:ATCO A
|
848.5B SEK | 11.9 | 32.1 | |
| US |

|
Illinois Tool Works Inc
NYSE:ITW
|
73.7B USD | 11.3 | 24 | |
| US |

|
Barnes Group Inc
NYSE:B
|
65B USD | 7.2 | 13 | |
| SE |

|
Sandvik AB
STO:SAND
|
480.6B SEK | 10.4 | 32.4 |
Market Distribution
| Min | 0.1 |
| 30th Percentile | 2.6 |
| Median | 3.7 |
| 70th Percentile | 5.9 |
| Max | 45 735 393.8 |
Other Multiples
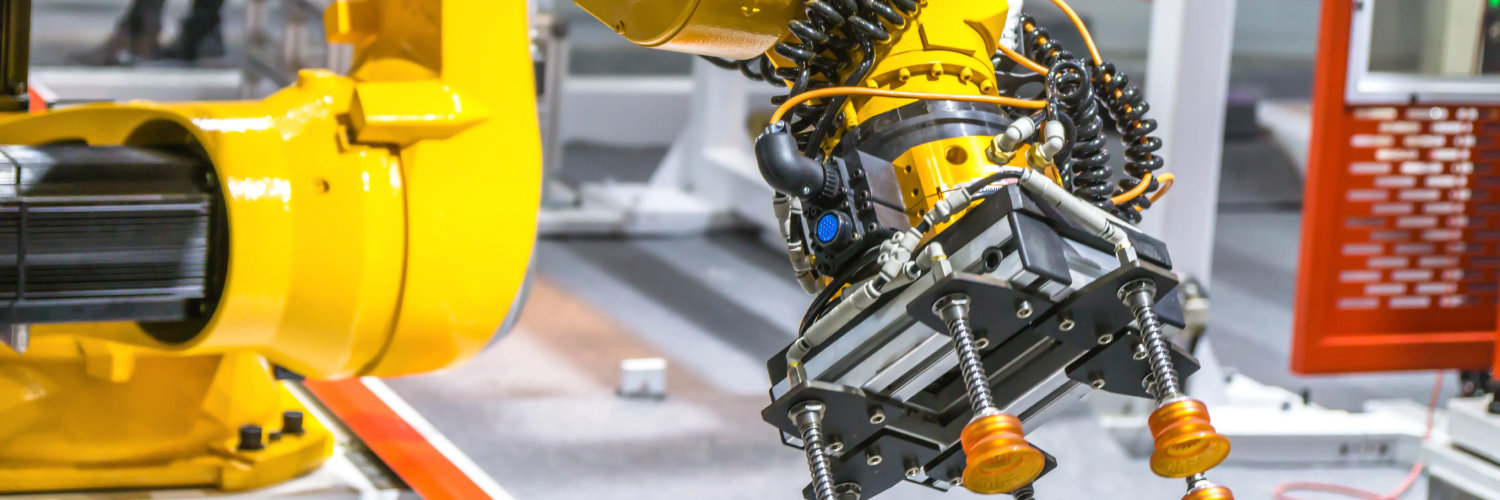
Fanuc Corp
Glance View
Fanuc Corporation, a global leader in automation and robotics, has carved its niche in the manufacturing sector since its founding in 1956. Headquartered in Yoshino, Japan, the company specializes in the production of industrial robots, CNC (computer numerical control) systems, and factory automation solutions. Over the decades, Fanuc has built a reputation for innovation and reliability, serving diverse industries from automotive to electronics. With a focus on enhancing productivity and reducing costs for manufacturers worldwide, Fanuc's advanced technologies empower companies to streamline operations and maintain competitive edges in an increasingly automated landscape. For investors, Fanuc presents an intriguing opportunity as it consistently reports healthy financial performance and has a robust balance sheet, reflecting strong cash flow generation and minimal debt levels. The company benefits from the rapidly growing demand for automation, driven by trends like Industry 4.0 and smart manufacturing. Fanuc's relentless pursuit of R&D and strategic partnerships positions it favorably for future growth, although potential challenges such as global economic fluctuations and supply chain disruptions warrant close monitoring. With a unique blend of tradition, forward-thinking innovation, and a commitment to excellence, Fanuc stands as a solid investment choice in the evolving technology landscape.
