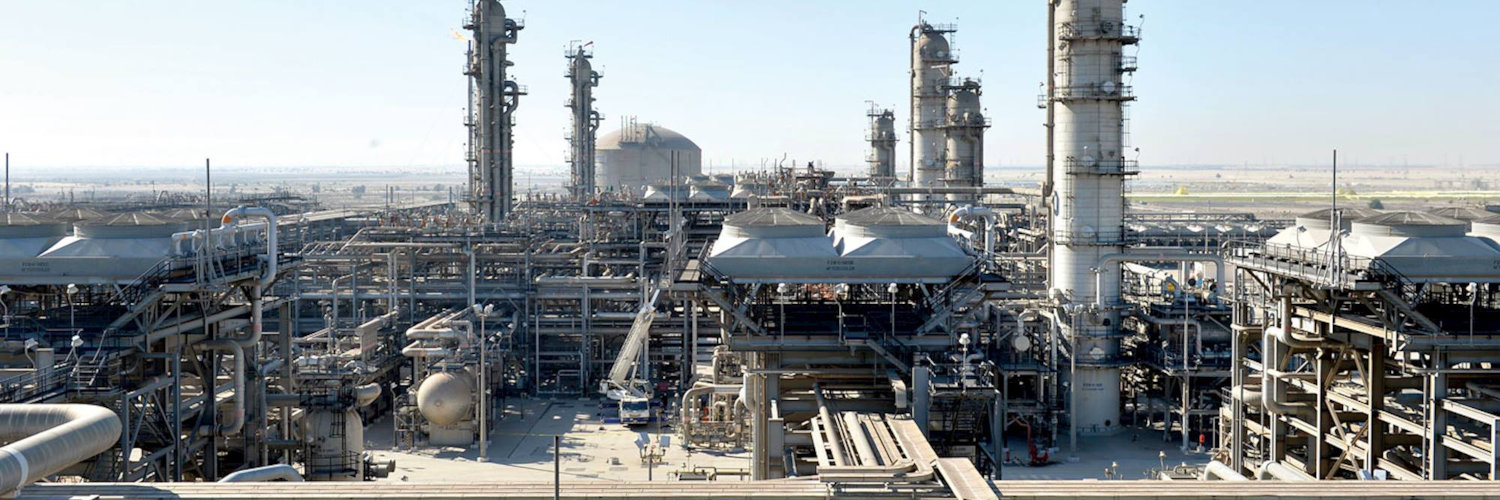

Saudi Arabian Oil Co
SAU:2222

Decide at what price you'd be comfortable buying and we'll help you stay ready.

|
Saudi Arabian Oil Co
SAU:2222
|
SA |

|
Fiserv Inc
NASDAQ:FISV
|
US |
|
V
|
Vistra Corp
F:0V6
|
US |
|
E
|
Electromagnetic Geoservices ASA
OSE:EMGS
|
NO |
|
P
|
Pearson PLC
F:PES
|
UK |

|
Yuen Foong Yu Consumer Products Co Ltd
TWSE:6790
|
TW |
|
G
|
Gibo Holdings Ltd
NASDAQ:GIBO
|
HK |
|
M
|
Merck KGaA
F:MRK
|
DE |
Profitability Summary
Saudi Arabian Oil Co's profitability score is Hidden . We take all the information about a company's profitability, such as its margins, capital efficiency, free cash flow generating ability, and more, and consolidate it into one single number: the profitability score. The higher the profitability score, the more profitable the company is.
Profitability Score
We take all the information about a company's profitability, such as its margins, capital efficiency, free cash flow generating ability, and more, and consolidate it into one single number: the profitability score. The higher the profitability score, the more profitable the company is.
We take all the information about a company's profitability, such as its margins, capital efficiency, free cash flow generating ability, and more, and consolidate it into one single number: the profitability score. The higher the profitability score, the more profitable the company is.
Profitability Score
