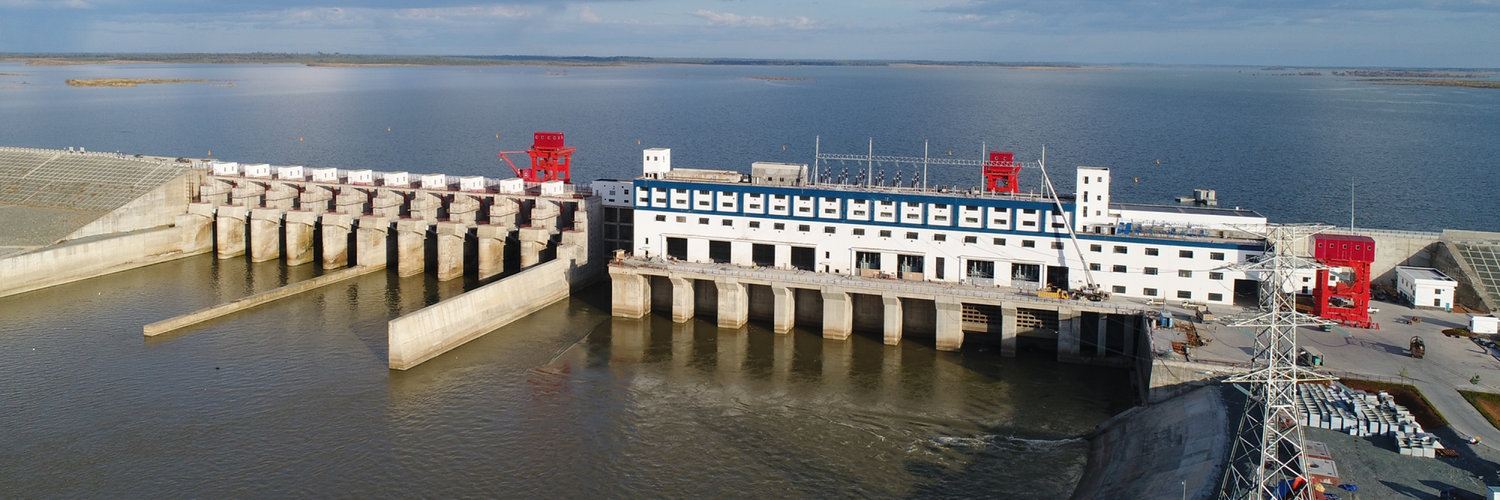
Huaneng Lancang River Hydropower Inc
SSE:600025

Decide at what price you'd be comfortable buying and we'll help you stay ready.

|
Huaneng Lancang River Hydropower Inc
SSE:600025
|
CN |
|
B
|
Bank Central Asia Tbk PT
F:BZG2
|
ID |
|
C
|
Cummins Inc
XBER:CUM
|
US |

|
GAIL (India) Ltd
NSE:GAIL
|
IN |
|
G
|
Gold Fields Ltd
JSE:GFI
|
ZA |
|
N
|
National Australia Bank Ltd
SWB:NAL
|
AU |

|
Equinix Inc
NASDAQ:EQIX
|
US |

|
Charter Communications Inc
NASDAQ:CHTR
|
US |

|
Lineage Cell Therapeutics Inc
F:BT3
|
US |
|
S
|
Societe Generale SA
OTC:SCGLF
|
FR |
|
O
|
Ovintiv Inc
F:47Q
|
US |

|
S1 Corp
KRX:012750
|
KR |

|
Tile Shop Holdings Inc
F:2TS0
|
US |
Profitability Summary
Huaneng Lancang River Hydropower Inc's profitability score is Hidden . We take all the information about a company's profitability, such as its margins, capital efficiency, free cash flow generating ability, and more, and consolidate it into one single number: the profitability score. The higher the profitability score, the more profitable the company is.
Profitability Score
We take all the information about a company's profitability, such as its margins, capital efficiency, free cash flow generating ability, and more, and consolidate it into one single number: the profitability score. The higher the profitability score, the more profitable the company is.
We take all the information about a company's profitability, such as its margins, capital efficiency, free cash flow generating ability, and more, and consolidate it into one single number: the profitability score. The higher the profitability score, the more profitable the company is.
Profitability Score
