
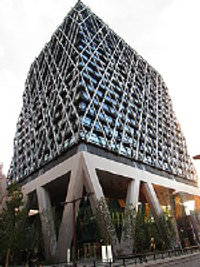
Seibu Holdings Inc
SWB:0H9


Decide at what price you'd be comfortable buying and we'll help you stay ready.
|
S
|
Seibu Holdings Inc
SWB:0H9
|
JP |
|
L
|
Loma Negra Compania Industrial Argentina SA
BCBA:LOMA
|
AR |
|
C
|
Celsius Resources Ltd
F:FX8
|
AU |
|
D
|
Digital Daesung Co Ltd
KOSDAQ:068930
|
KR |
|
Morguard Corp
TSX:MRC
|
CA |
|
B
|
Bechtle AG
XHAM:BC8
|
DE |
|
C
|
CITIC Ltd
OTC:CTPCY
|
CN |

|
Adidas AG
F:ADS1
|
DE |
|
P
|
PepsiCo Inc
SIX:PEP
|
US |

|
Cedar Fair LP
NYSE:FUN
|
US |

|
Silicius Real Estate SOCIMI SA
MAD:YSIL
|
ES |

|
PTC India Ltd
BSE:532524
|
IN |
|
S
|
SSE PLC
DUS:SCT
|
UK |
|
L
|
Lifestyle Communities Ltd
OTC:LCOMF
|
AU |

|
Auckland International Airport Ltd
NZX:AIA
|
NZ |
|
Takasago Thermal Engineering Co Ltd
TSE:1969
|
JP |
|
Chariot Ltd
F:C62
|
UK |
|
Mativ Holdings Inc
NYSE:MATV
|
US |
|
W
|
Warrior Met Coal Inc
F:WJ4
|
US |
|
F
|
Funding Circle Holdings PLC
OTC:FDCHF
|
UK |
|
E
|
Euronext Athens Holding SA
SWB:HEE
|
GR |
|
T
|
Tosoh Corp
F:TOS
|
JP |
|
Estee Lauder Companies Inc
NYSE:EL
|
US |
|
Osram Licht AG
OTC:OSAGF
|
DE |
Dividends
Dividend Yield
Seibu Holdings Inc
| Current Yield | |
| Min Yield | |
| Max Yield | |
| Average Yield | |
| Median Yield |
Dividend Per Share
Seibu Holdings Inc
0H9 have increased by 301%.
Payout Ratio
Seibu Holdings Inc
Peers Comparison
Dividends
Shareholder Yield
Current shareholder yield for 0H9 is
hidden
.
Peers Comparison
Shareholder Yield
Buybacks
Buyback Yield measures how much a company reduces its outstanding shares through repurchases, expressed as a percentage.
This metric directly reflects the company’s efforts to return value to shareholders. By reducing the number of shares, buybacks can increase earnings per share and potentially boost the stock's price.

Peers Comparison
Buybacks
Debt Paydown
Debt Paydown Yield measures the amount of debt a company repays within a specific period, shown as a percentage of its market capitalization.
This metric indicates how the company is using its capital to decrease financial liabilities, which can strengthen its financial health and potentially enhance shareholder value.
Peers Comparison
Debt Paydown
Price Appreciation
0H9 Price
Seibu Holdings Inc
| Average Annual Return | 99.94% |
| Standard Deviation of Annual Returns | 176.83% |
| Max Drawdown | -47% |
| Market Capitalization | 1.1T EUR |
| Shares Outstanding | 196 484 380 |
| Percentage of Shares Shorted |
N/A
|
