Campbell Soup Co
SWB:CSC

Decide at what price you'd be comfortable buying and we'll help you stay ready.
|
C
|
Campbell Soup Co
SWB:CSC
|
US |

|
Trivago NV
NASDAQ:TRVG
|
DE |
|
M
|
Medtronic PLC
DUS:2M6
|
IE |
|
C
|
China Reinsurance Group Corp
HKEX:1508
|
CN |
|
B
|
BlackRock Inc
XBER:BLQA
|
US |
|
D
|
Deutsche Boerse AG
XHAM:DB1
|
DE |
|
V
|
VCI Global Ltd
NASDAQ:VCIG
|
MY |
|
C
|
C&C Group PLC
XBER:GCC
|
IE |
|
E
|
Element79 Gold Corp
CNSX:ELEM
|
CA |

|
Klepierre SA
OTC:KLPEF
|
FR |
|
E
|
EDP Energias de Portugal SA
SWB:EDP
|
PT |

|
Schibsted ASA
F:XPG
|
NO |

|
China Yangtze Power Co Ltd
LSE:CYPC
|
CN |

|
Bradespar SA
BOVESPA:BRAP3
|
BR |
Wall St Price Targets
CSC Price Targets Summary
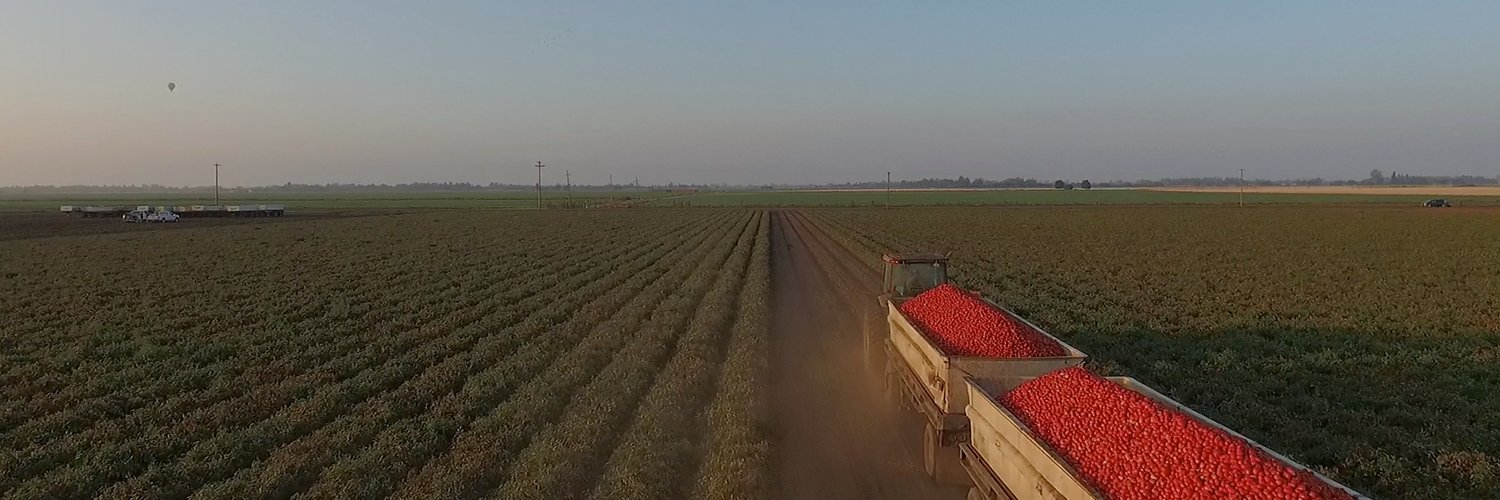
Campbell Soup Co

According to Wall Street analysts, the average 1-year price target for CSC is 20.975 EUR with a low forecast of 14.632 EUR and a high forecast of 52.99 EUR.


Our estimates are sourced from the pool of sell-side and buy-side analysts that we have access to. What you see on other sites is mostly sourced from sell-side analysts.
What is CSC's stock price target?
Price Target
20.975
EUR
According to Wall Street analysts, the average 1-year price target for CSC is 20.975 EUR with a low forecast of 14.632 EUR and a high forecast of 52.99 EUR.
What is the Revenue forecast for Campbell Soup Co?
Projected CAGR
2%
Over the last 13 years, the compound annual growth rate for Revenue has been 3%. The projected CAGR for the next 8 years is 2%.
What is the Operating Income forecast for Campbell Soup Co?
Projected CAGR
-1%
Over the last 13 years, the compound annual growth rate for Operating Income has been 2%. The projected CAGR for the next 4 years is -1%.
What is the Net Income forecast for Campbell Soup Co?
Projected CAGR
13%
Over the last 13 years, the compound annual growth rate for Net Income has been -2%. The projected CAGR for the next 8 years is 13%.
