
Proto Labs Inc
SWB:PRZ

Decide at what price you'd be comfortable buying and we'll help you stay ready.

|
Johnson & Johnson
NYSE:JNJ
|
US |

|
Berkshire Hathaway Inc
NYSE:BRK.A
|
US |

|
Bank of America Corp
NYSE:BAC
|
US |

|
Mastercard Inc
NYSE:MA
|
US |

|
UnitedHealth Group Inc
NYSE:UNH
|
US |

|
Exxon Mobil Corp
NYSE:XOM
|
US |

|
Pfizer Inc
NYSE:PFE
|
US |

|
Nike Inc
NYSE:NKE
|
US |

|
Visa Inc
NYSE:V
|
US |

|
Alibaba Group Holding Ltd
NYSE:BABA
|
CN |

|
JPMorgan Chase & Co
NYSE:JPM
|
US |

|
Coca-Cola Co
NYSE:KO
|
US |

|
Verizon Communications Inc
NYSE:VZ
|
US |

|
Chevron Corp
NYSE:CVX
|
US |

|
Walt Disney Co
NYSE:DIS
|
US |

|
PayPal Holdings Inc
NASDAQ:PYPL
|
US |
EV/EBITDA
Enterprise Value to EBITDA (EV/EBITDA) ratio compares a company`s total enterprise value to its earnings before interest, taxes, depreciation, and amortization. It shows how much investors are paying for each dollar of the company`s earnings, including both equity and debt.
Enterprise Value to EBITDA (EV/EBITDA) ratio compares a company`s total enterprise value to its earnings before interest, taxes, depreciation, and amortization. It shows how much investors are paying for each dollar of the company`s earnings, including both equity and debt.
Valuation Scenarios
If EV/EBITDA returns to its 3-Year Average (12.9), the stock would be worth €27.38 (45% downside from current price).
| Scenario | EV/EBITDA Value | Implied Price | Upside/Downside |
|---|---|---|---|
| Current Multiple | 23.3 | €49.46 |
0%
|
| 3-Year Average | 12.9 | €27.38 |
-45%
|
| 5-Year Average | 14.1 | €29.94 |
-39%
|
| Industry Average | 14.8 | €31.56 |
-36%
|
| Country Average | 14.4 | €30.52 |
-38%
|
Forward EV/EBITDA
Today’s price vs future ebitda
| Today's Enterprise Value | EBITDA | Forward EV/EBITDA | ||
|---|---|---|---|---|
|
€1.4B
|
/ |
Jan 2026
$60m
|
= |
|
|
€1.4B
|
/ |
Dec 2026
$86m
|
= |
|
|
€1.4B
|
/ |
Dec 2027
$93.9m
|
= |
|
Forward EV/EBITDA shows whether today’s EV/EBITDA still looks high or low once future ebitda are taken into account.
Peer Comparison
| Market Cap | EV/EBITDA | P/E | ||||
|---|---|---|---|---|---|---|
| US |

|
Proto Labs Inc
SWB:PRZ
|
1.5B EUR | 23.3 | 71.5 | |
| JP |
F
|
Fujitec Co Ltd
TSE:6406
|
2 720 795.8T JPY | 12.8 | 0 | |
| JP |
I
|
Ishii Iron Works Co Ltd
TSE:6362
|
304.2T JPY | 171 820.3 | 363 670.8 | |
| JP |
S
|
Star Micronics Co Ltd
TSE:7718
|
48T JPY | 8.2 | 29.8 | |
| US |

|
Parker-Hannifin Corp
NYSE:PH
|
120.4B USD | 23.9 | 34.1 | |
| JP |

|
Freund Corp
TSE:6312
|
16.9T JPY | 4 698.9 | 8 494.3 | |
| JP |

|
Mitsubishi Heavy Industries Ltd
TSE:7011
|
16T JPY | 27.7 | 56.9 | |
| SE |

|
Atlas Copco AB
STO:ATCO A
|
911.3B SEK | 20.6 | 34.3 | |
| US |

|
Illinois Tool Works Inc
NYSE:ITW
|
77.1B USD | 18.1 | 25.1 | |
| US |

|
Barnes Group Inc
NYSE:B
|
68.2B USD | 6.6 | 13.6 | |
| SE |

|
Sandvik AB
STO:SAND
|
492.1B SEK | 17.9 | 33.5 |
Market Distribution
| Min | 0 |
| 30th Percentile | 10 |
| Median | 14.4 |
| 70th Percentile | 21.5 |
| Max | 1 767 274.1 |
Other Multiples
Proto Labs Inc
Glance View
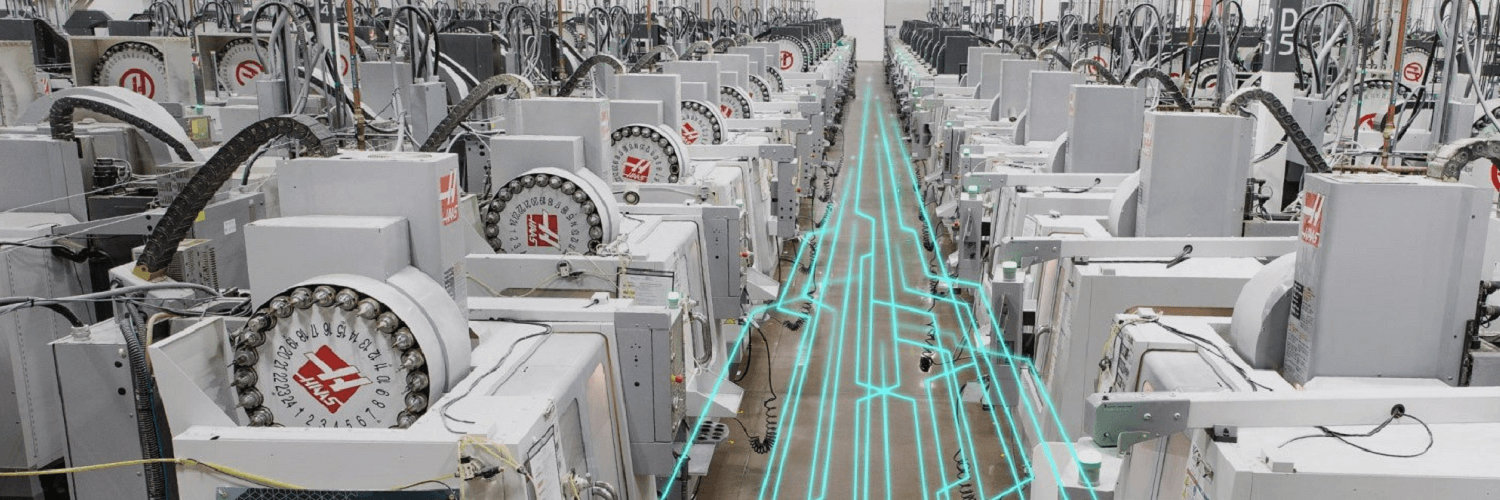
Proto Labs Inc. began its journey in the late 1990s with an innovative vision to revolutionize the world of manufacturing. At a time when speed and efficiency were becoming increasingly essential for businesses, Proto Labs emerged as a pioneer in rapid prototyping and custom manufacturing. The company harnessed advanced digital technologies to streamline the production of prototypes and small-batch parts by using CNC machining, injection molding, 3D printing, and sheet metal fabrication processes. Their approach drastically reduced the time required to bring new products from concept to market. By leveraging their proprietary software, Proto Labs simplified the intricate processes of design and production, allowing engineers and designers to quickly obtain prototypes and parts, accelerating innovation and reducing development costs. Proto Labs' business model is rooted in providing unparalleled speed and flexibility, making it invaluable for industries ranging from aerospace and automotive to healthcare and consumer products. The company operates through a robust e-commerce platform that enables customers to easily upload their designs, receive instant quotes, and test functional prototypes within days rather than weeks. This agility has resonated well with both startups and established firms that have little room for manufacturing delays. By charging competitive prices for speed and precision, Proto Labs has carved out a profitable niche within the manufacturing sector. This unique mix of cutting-edge technology, strategic market positioning, and dedication to efficiency underpins their revenue generation, positioning Proto Labs as a formidable player in the realm of digital manufacturing solutions.
