Nissin Foods Holdings Co Ltd
TSE:2897

Decide at what price you'd be comfortable buying and we'll help you stay ready.

|
Johnson & Johnson
NYSE:JNJ
|
US |

|
Berkshire Hathaway Inc
NYSE:BRK.A
|
US |

|
Bank of America Corp
NYSE:BAC
|
US |

|
Mastercard Inc
NYSE:MA
|
US |

|
UnitedHealth Group Inc
NYSE:UNH
|
US |

|
Exxon Mobil Corp
NYSE:XOM
|
US |

|
Pfizer Inc
NYSE:PFE
|
US |

|
Nike Inc
NYSE:NKE
|
US |

|
Visa Inc
NYSE:V
|
US |

|
Alibaba Group Holding Ltd
NYSE:BABA
|
CN |

|
JPMorgan Chase & Co
NYSE:JPM
|
US |

|
Coca-Cola Co
NYSE:KO
|
US |

|
Verizon Communications Inc
NYSE:VZ
|
US |

|
Chevron Corp
NYSE:CVX
|
US |

|
Walt Disney Co
NYSE:DIS
|
US |

|
PayPal Holdings Inc
NASDAQ:PYPL
|
US |
 Nissin Foods Holdings Co Ltd
Income from Continuing Operations
Nissin Foods Holdings Co Ltd
Income from Continuing Operations
Nissin Foods Holdings Co Ltd
Income from Continuing Operations Peer Comparison
Competitors Analysis
Latest Figures & CAGR of Competitors
| Company | Income from Continuing Operations | CAGR 3Y | CAGR 5Y | CAGR 10Y | ||
|---|---|---|---|---|---|---|
|
|
Nissin Foods Holdings Co Ltd
TSE:2897
|
Income from Continuing Operations
¥54.2B
|
CAGR 3-Years
8%
|
CAGR 5-Years
5%
|
CAGR 10-Years
9%
|
|
|
Yakult Honsha Co Ltd
TSE:2267
|
Income from Continuing Operations
¥49.3B
|
CAGR 3-Years
-3%
|
CAGR 5-Years
1%
|
CAGR 10-Years
3%
|
|

|
Ajinomoto Co Inc
TSE:2802
|
Income from Continuing Operations
¥87.5B
|
CAGR 3-Years
5%
|
CAGR 5-Years
6%
|
CAGR 10-Years
-1%
|
|

|
Meiji Holdings Co Ltd
TSE:2269
|
Income from Continuing Operations
¥50.2B
|
CAGR 3-Years
-15%
|
CAGR 5-Years
-6%
|
CAGR 10-Years
-1%
|
|

|
Kikkoman Corp
TSE:2801
|
Income from Continuing Operations
¥62.2B
|
CAGR 3-Years
12%
|
CAGR 5-Years
14%
|
CAGR 10-Years
12%
|
|

|
Toyo Suisan Kaisha Ltd
TSE:2875
|
Income from Continuing Operations
¥64.4B
|
CAGR 3-Years
29%
|
CAGR 5-Years
17%
|
CAGR 10-Years
13%
|
|
Nissin Foods Holdings Co Ltd
Glance View
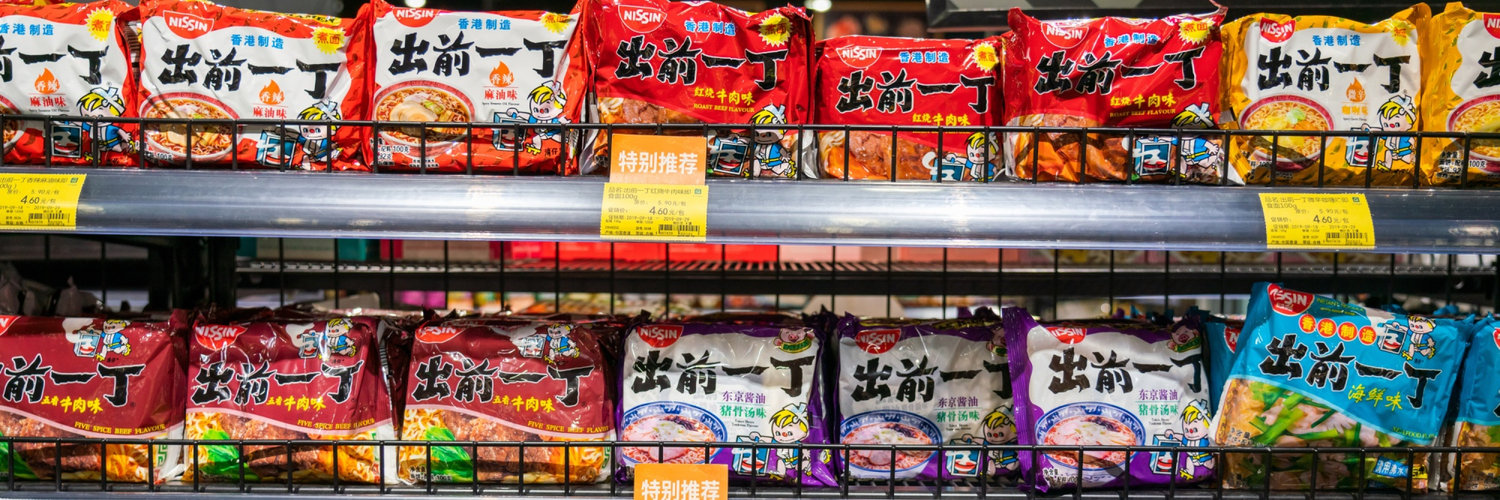
In the bustling landscape of global food manufacturing, Nissin Foods Holdings Co Ltd stands as a towering figure, pioneering the instant noodle industry since its inception in 1948 by the visionary Momofuku Ando. The company's origins trace back to Japan post-World War II, a time marked by food shortages and economic constraints. Ando’s innovation of the first instant noodle, Chikin Ramen, in 1958, revolutionized the way the world consumed quick meals. Nissin has since expanded its portfolio beyond just instant noodles to include a diverse range of food products. While the company’s heart remains with its flagship brand, Cup Noodles, it continually innovates, introducing healthier options and exploring new flavors to cater to the evolving tastes of consumers globally. As a multinational corporation, Nissin ingeniously capitalizes on both production and distribution to drive growth and profitability. Anchored by strategic factories across Asia, North America, and Europe, the company efficiently scales its operations to meet global demands. This extensive network not only reduces logistical costs but also allows Nissin to adapt quickly to local tastes and preferences, a crucial component of its business model. Moreover, by maintaining a robust marketing strategy that emphasizes convenience and affordability, coupled with collaborations with retailers and food service providers, Nissin ensures its iconic products are accessible to a wide audience. This strategy, underpinned by continuous product innovation and strategic market penetration, solidifies Nissin's position as an industry leader in the world of instant foods.
See Also
What is Nissin Foods Holdings Co Ltd's Income from Continuing Operations?
Income from Continuing Operations
54.2B
JPY
Based on the financial report for Dec 31, 2025, Nissin Foods Holdings Co Ltd's Income from Continuing Operations amounts to 54.2B JPY.
What is Nissin Foods Holdings Co Ltd's Income from Continuing Operations growth rate?
Income from Continuing Operations CAGR 10Y
9%
Over the last year, the Income from Continuing Operations growth was 3%. The average annual Income from Continuing Operations growth rates for Nissin Foods Holdings Co Ltd have been 8% over the past three years , 5% over the past five years , and 9% over the past ten years .
