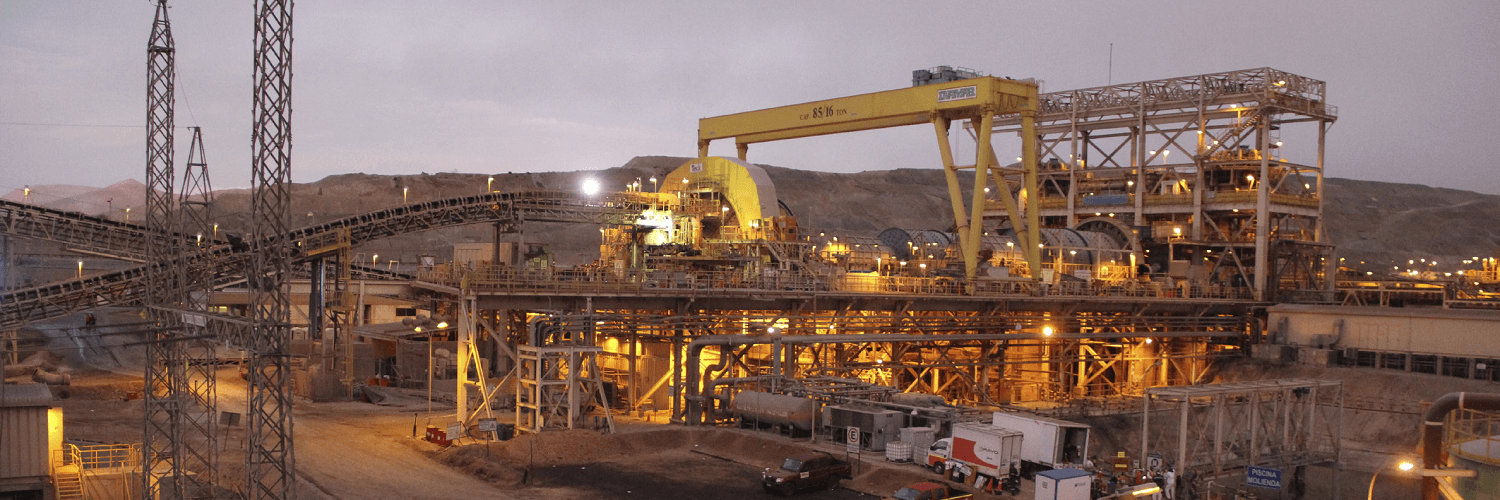

Teck Resources Ltd
TSX:TECK.A

Decide at what price you'd be comfortable buying and we'll help you stay ready.
|
T
|
Teck Resources Ltd
TSX:TECK.A
|
CA |
|
S
|
Sirius XM Holdings Inc
XETRA:RDO
|
US |

|
Bill.com Holdings Inc
NYSE:BILL
|
US |

|
WPIL Ltd
BSE:505872
|
IN |

|
Hornbach Holding AG & Co KGaA
OTC:HBBHF
|
DE |

|
Alsea SAB de CV
BMV:ALSEA
|
MX |

|
Cerence Inc
NASDAQ:CRNC
|
US |

|
Iberdrola SA
MAD:IBE
|
ES |

|
United Nilgiri Tea Estates Company Ltd
NSE:UNITEDTEA
|
IN |
|
D
|
Duopharma Biotech Bhd
KLSE:DPHARMA
|
MY |

|
Danaher Corp
NYSE:DHR
|
US |

|
TomTom NV
OTC:TMOAF
|
NL |

|
Dynavax Technologies Corp
NASDAQ:DVAX
|
US |
|
S
|
Supalai PCL
SET:SPALI
|
TH |
Dividends
Dividend Yield
Teck Resources Ltd

| Current Yield | |
| Min Yield | |
| Max Yield | |
| Average Yield | |
| Median Yield |
Dividend Per Share
Teck Resources Ltd
TECK.A have increased by 525%.
Payout Ratio
Teck Resources Ltd
Peers Comparison
Dividends
Shareholder Yield
Current shareholder yield for TECK.A is
hidden
.
Peers Comparison
Shareholder Yield
Buybacks
Buyback Yield measures how much a company reduces its outstanding shares through repurchases, expressed as a percentage.
This metric directly reflects the company’s efforts to return value to shareholders. By reducing the number of shares, buybacks can increase earnings per share and potentially boost the stock's price.

Peers Comparison
Buybacks
Debt Paydown
Debt Paydown Yield measures the amount of debt a company repays within a specific period, shown as a percentage of its market capitalization.
This metric indicates how the company is using its capital to decrease financial liabilities, which can strengthen its financial health and potentially enhance shareholder value.
Peers Comparison
Debt Paydown
Price Appreciation
TECK.A Price
Teck Resources Ltd
| Average Annual Return | 10.92% |
| Standard Deviation of Annual Returns | 18.03% |
| Max Drawdown | -60% |
| Market Capitalization | 33.1B CAD |
| Shares Outstanding | 518 440 000 |
| Percentage of Shares Shorted |
N/A
|
TECK.A Return Decomposition
Main factors of price return
Stock Splits
TECK.A's latest stock split occurred on May 3, 2007
The company executed a 2-for-1 stock split, meaning that for every share held, investors received 2 new shares.
The adjusted shares began trading on May 3, 2007. This was the only stock split in TECK.A's history.
