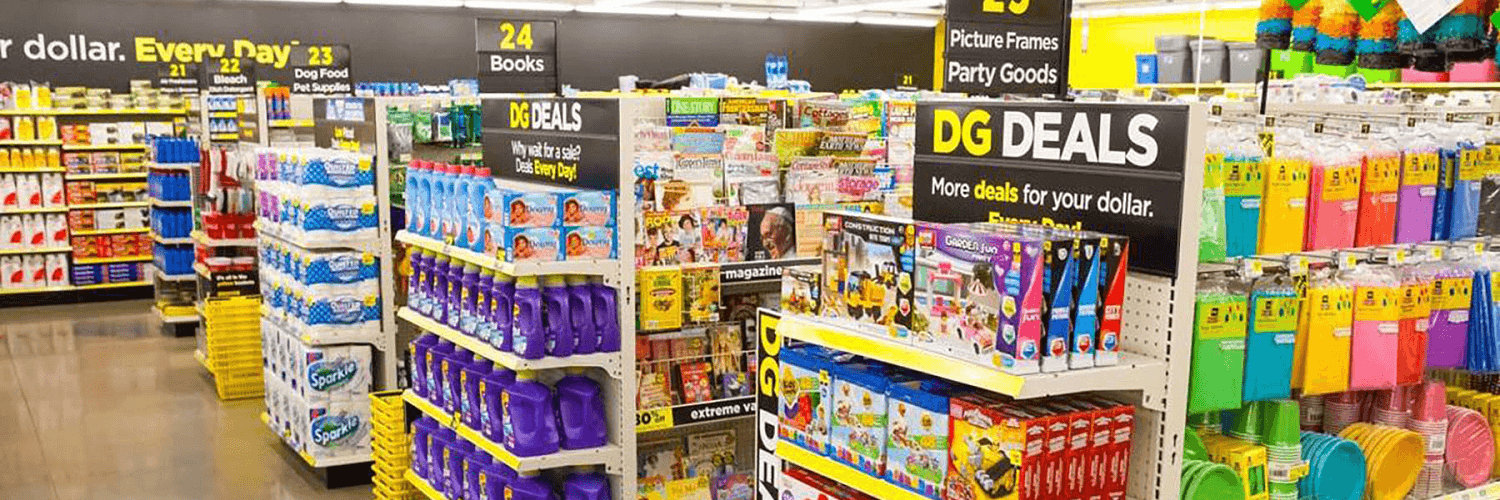
Dollar General Corp
XBER:7DG

Decide at what price you'd be comfortable buying and we'll help you stay ready.
|
D
|
Dollar General Corp
XBER:7DG
|
US |
|
T
|
Thales SA
XBER:CSF
|
FR |
|
T
|
TAG Immobilien AG
XHAM:TEG
|
DE |

|
Medicover AB
LSE:0RPS
|
SE |
|
N
|
Netflix Inc
BMV:NFLX
|
US |

|
Coca Cola HBC AG
F:CCKC
|
CH |
|
C
|
CF Industries Holdings Inc
F:C4F
|
US |
|
P
|
PTC Therapeutics Inc
XMUN:BH3
|
US |
|
L
|
Lowe's Companies Inc
SWB:LWE
|
US |
|
P
|
Pila Pharma AB
STO:PILA
|
SE |
|
U
|
United Rentals Inc
XBER:UR3
|
US |
|
N
|
Nordstrom Inc
DUS:NRD
|
US |

|
Zurich Insurance Group AG
OTC:ZURVY
|
CH |

|
ICF International Inc
NASDAQ:ICFI
|
US |

|
Environmental Group Ltd
F:E7G
|
AU |
|
Peab AB
F:PEKB
|
SE |
|
N
|
Next PLC
F:NXG
|
UK |
|
V
|
Vodafone Group PLC
F:VODJ
|
UK |

|
Ryohin Keikaku Co Ltd
F:3RKU
|
JP |
|
S
|
Sailfish Royalty Corp
XTSX:FISH
|
VG |
|
Gunma Bank Ltd
F:5F0
|
JP |
|
P
|
Panasonic Holdings Corp
SWB:MATA
|
JP |
|
B
|
Bristol-Myers Squibb Co
F:BRM
|
US |
|
H
|
Hermes International SCA
XMUN:HMI
|
FR |
Dividends
Dividend Yield
Dollar General Corp

| Current Yield | |
| Min Yield | |
| Max Yield | |
| Average Yield | |
| Median Yield |
Dividend Per Share
Dollar General Corp
7DG have increased by 105%.
Payout Ratio
Dollar General Corp
Peers Comparison
Dividends
Shareholder Yield
Current shareholder yield for 7DG is
hidden
.
Peers Comparison
Shareholder Yield
Buybacks
Buyback Yield measures how much a company reduces its outstanding shares through repurchases, expressed as a percentage.
This metric directly reflects the company’s efforts to return value to shareholders. By reducing the number of shares, buybacks can increase earnings per share and potentially boost the stock's price.

Peers Comparison
Buybacks
Debt Paydown
Debt Paydown Yield measures the amount of debt a company repays within a specific period, shown as a percentage of its market capitalization.
This metric indicates how the company is using its capital to decrease financial liabilities, which can strengthen its financial health and potentially enhance shareholder value.
Peers Comparison
Debt Paydown
Price Appreciation
7DG Price
Dollar General Corp
| Average Annual Return | -14.4% |
| Standard Deviation of Annual Returns | 34.01% |
| Max Drawdown | -75% |
| Market Capitalization | 25.9B EUR |
| Shares Outstanding | 413 309 448 |
| Percentage of Shares Shorted |
N/A
|
