Duerr AG
XETRA:DUE
Net Margin
Net Margin shows how much profit a company keeps from each dollar of sales after all expenses, including taxes and interest. It reflects the company`s overall profitability.
Net Margin shows how much profit a company keeps from each dollar of sales after all expenses, including taxes and interest. It reflects the company`s overall profitability.
Peer Comparison
| Country | Company | Market Cap |
Net Margin |
||
|---|---|---|---|---|---|
| DE |

|
Duerr AG
XETRA:DUE
|
1.6B EUR |
Loading...
|
|
| JP |
I
|
Ishii Iron Works Co Ltd
TSE:6362
|
304.2T JPY |
Loading...
|
|
| US |

|
Parker-Hannifin Corp
NYSE:PH
|
123.3B USD |
Loading...
|
|
| JP |

|
Freund Corp
TSE:6312
|
16.9T JPY |
Loading...
|
|
| JP |

|
Mitsubishi Heavy Industries Ltd
TSE:7011
|
16.7T JPY |
Loading...
|
|
| SE |

|
Atlas Copco AB
STO:ATCO A
|
920.4B SEK |
Loading...
|
|
| US |

|
Illinois Tool Works Inc
NYSE:ITW
|
84.3B USD |
Loading...
|
|
| US |

|
Barnes Group Inc
NYSE:B
|
78B USD |
Loading...
|
|
| SE |

|
Sandvik AB
STO:SAND
|
471.1B SEK |
Loading...
|
|
| CH |

|
Schindler Holding AG
SIX:SCHP
|
33.2B CHF |
Loading...
|
|
| JP |

|
Fanuc Corp
TSE:6954
|
6.3T JPY |
Loading...
|
Market Distribution
| Min | -222 027.4% |
| 30th Percentile | -2% |
| Median | 2.2% |
| 70th Percentile | 6% |
| Max | 85 055.6% |
Other Profitability Ratios
Duerr AG
Glance View
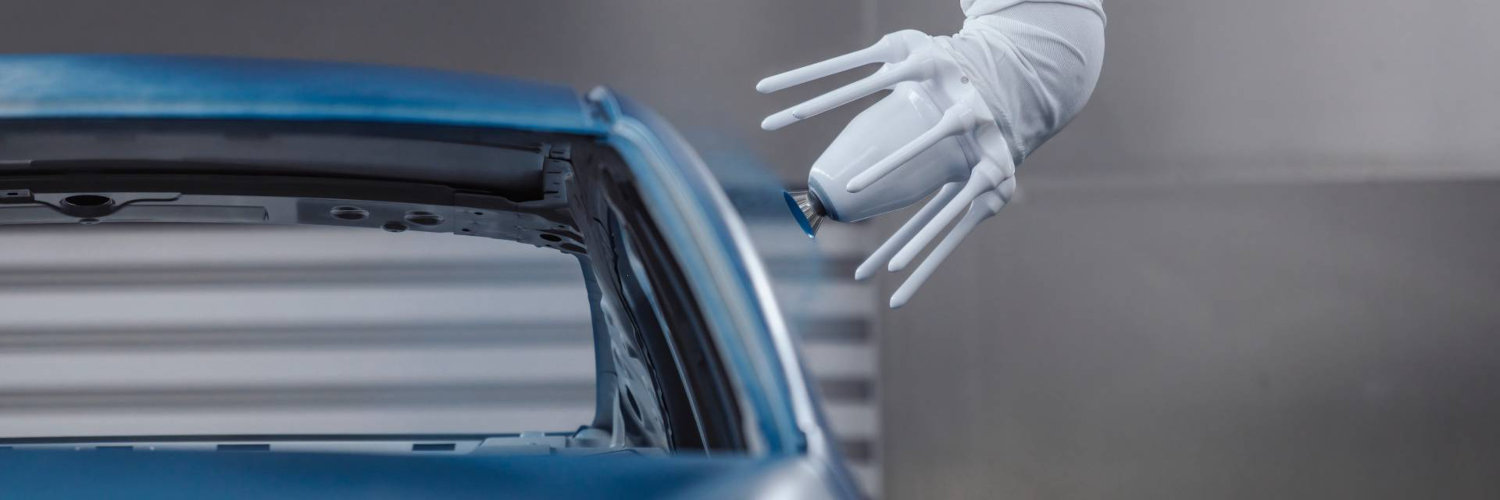
Duerr AG, a stalwart in the industrial landscape, stands as an exemplar of German engineering prowess, with roots tracing back to 1895. Headquartered in Stuttgart, this company has evolved deftly over the decades, specializing in high-tech mechanical and plant engineering solutions. Duerr’s primary clientele hails from the automotive industry, but its influence extends across various sectors including woodworking and the chemical industry. Through its well-diversified five divisions—Paint and Final Assembly Systems, Application Technology, Clean Technology Systems, Measuring and Process Systems, and Woodworking Machinery—Duerr crafts solutions that enhance production efficiency. The Paint and Final Assembly Systems division, for instance, offers cutting-edge technology for vehicle body painting and assembly, ensuring that Duerr remains a key partner to major automotive giants. In today’s rapidly advancing world, Duerr capitalizes on its innate ability to integrate digital technology with industrial applications. The company accrues substantial revenue from offering intelligent production processes and specialized equipment. In the realm of digital transformation, its business model thrives by offering smart data analytics and consulting services to optimize manufacturing operations. Furthermore, Duerr’s commitment to sustainability is evidenced through its Clean Technology Systems division, which addresses the growing demand for exhaust-air purification and energy-efficiency solutions. By aligning traditional engineering with contemporary digital approaches, Duerr AG ensures its portfolio remains robust and relevant, with a clear focus on fostering long-term partnerships anchored in innovation and efficiency.
See Also
Net Margin is calculated by dividing the Net Income by the Revenue.
The current Net Margin for Duerr AG is -0.8%, which is below its 3-year median of 2%.
Over the last 3 years, Duerr AG’s Net Margin has decreased from 2.7% to -0.8%. During this period, it reached a low of -0.8% on Sep 30, 2025 and a high of 3.5% on Sep 30, 2023.
