
Omni Lite Industries Canada Inc
XTSX:OML


Utilize notes to systematically review your investment decisions. By reflecting on past outcomes, you can discern effective strategies and identify those that underperformed. This continuous feedback loop enables you to adapt and refine your approach, optimizing for future success.
Each note serves as a learning point, offering insights into your decision-making processes. Over time, you'll accumulate a personalized database of knowledge, enhancing your ability to make informed decisions quickly and effectively.
With a comprehensive record of your investment history at your fingertips, you can compare current opportunities against past experiences. This not only bolsters your confidence but also ensures that each decision is grounded in a well-documented rationale.
Do you really want to delete this note?
This action cannot be undone.

| 52 Week Range |
0.95
1.9
|
| Price Target |
|
We'll email you a reminder when the closing price reaches CAD.
Choose the stock you wish to monitor with a price alert.
This alert will be permanently deleted.
Net Margin
Net Margin shows how much profit a company keeps from each dollar of sales after all expenses, including taxes and interest. It reflects the company`s overall profitability.
Net Margin shows how much profit a company keeps from each dollar of sales after all expenses, including taxes and interest. It reflects the company`s overall profitability.
Peer Comparison
| Country | Company | Market Cap |
Net Margin |
||
|---|---|---|---|---|---|
| US |
|
Omni Lite Industries Canada Inc
XTSX:OML
|
22.1m CAD |
Loading...
|
|
| JP |
I
|
Ishii Iron Works Co Ltd
TSE:6362
|
304.2T JPY |
Loading...
|
|
| US |

|
Parker-Hannifin Corp
NYSE:PH
|
119.5B USD |
Loading...
|
|
| SE |

|
Atlas Copco AB
STO:ATCO A
|
893.1B SEK |
Loading...
|
|
| JP |

|
Mitsubishi Heavy Industries Ltd
TSE:7011
|
15.2T JPY |
Loading...
|
|
| US |

|
Barnes Group Inc
NYSE:B
|
89.4B USD |
Loading...
|
|
| US |

|
Illinois Tool Works Inc
NYSE:ITW
|
75.6B USD |
Loading...
|
|
| SE |

|
Sandvik AB
STO:SAND
|
445.2B SEK |
Loading...
|
|
| CH |

|
Schindler Holding AG
SIX:SCHP
|
32.2B CHF |
Loading...
|
|
| FI |
K
|
Kone Oyj
OMXH:KNEBV
|
31.5B EUR |
Loading...
|
|
| JP |

|
Fanuc Corp
TSE:6954
|
5.7T JPY |
Loading...
|
Market Distribution
| Min | -4 418 600% |
| 30th Percentile | -9.6% |
| Median | 3.1% |
| 70th Percentile | 11.3% |
| Max | 1 135 400% |
Other Profitability Ratios
Omni Lite Industries Canada Inc
Glance View
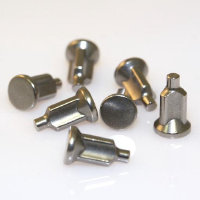
Omni-Lite Industries Canada, Inc. develops, manufactures, and sells precision components to Fortune 100 companies in the United States, Canada, and Barbados. The company is headquartered in Cerritos, California. The firm operates its manufacturing and engineering activities in Cerritos, California and Nashua, New Hampshire. The Company’s products include components for the aerospace, military, specialty automotive and sports and recreational industries. The firm work with its customers to design customized multi-step forming processes for both hot and cold forming, which eliminates secondary operations, such as machining holes and deburring/tumbling.
See Also
Net Margin is calculated by dividing the Net Income by the Revenue.
The current Net Margin for Omni Lite Industries Canada Inc is -0.2%, which is above its 3-year median of -2.6%.
Over the last 3 years, Omni Lite Industries Canada Inc’s Net Margin has increased from -7.6% to -0.2%. During this period, it reached a low of -16.9% on Dec 31, 2022 and a high of 5.6% on Jun 30, 2024.

