

Artemis Resources Ltd
ASX:ARV


Utilize notes to systematically review your investment decisions. By reflecting on past outcomes, you can discern effective strategies and identify those that underperformed. This continuous feedback loop enables you to adapt and refine your approach, optimizing for future success.
Each note serves as a learning point, offering insights into your decision-making processes. Over time, you'll accumulate a personalized database of knowledge, enhancing your ability to make informed decisions quickly and effectively.
With a comprehensive record of your investment history at your fingertips, you can compare current opportunities against past experiences. This not only bolsters your confidence but also ensures that each decision is grounded in a well-documented rationale.
Do you really want to delete this note?
This action cannot be undone.

| 52 Week Range |
0.004
0.011
|
| Price Target |
|
We'll email you a reminder when the closing price reaches AUD.
Choose the stock you wish to monitor with a price alert.
This alert will be permanently deleted.
Net Margin
Net Margin shows how much profit a company keeps from each dollar of sales after all expenses, including taxes and interest. It reflects the company`s overall profitability.
Net Margin shows how much profit a company keeps from each dollar of sales after all expenses, including taxes and interest. It reflects the company`s overall profitability.
Peer Comparison
| Country | Company | Market Cap |
Net Margin |
||
|---|---|---|---|---|---|
| AU |
|
Artemis Resources Ltd
ASX:ARV
|
26.4m AUD |
Loading...
|
|
| AU |

|
BHP Group Ltd
ASX:BHP
|
261.8B AUD |
Loading...
|
|
| AU |

|
Rio Tinto Ltd
ASX:RIO
|
253.2B AUD |
Loading...
|
|
| UK |

|
Rio Tinto PLC
LSE:RIO
|
111B GBP |
Loading...
|
|
| MX |

|
Grupo Mexico SAB de CV
BMV:GMEXICOB
|
1.6T MXN |
Loading...
|
|
| CH |

|
Glencore PLC
LSE:GLEN
|
63.6B GBP |
Loading...
|
|
| CN |

|
CMOC Group Ltd
SSE:603993
|
570.4B CNY |
Loading...
|
|
| SA |

|
Saudi Arabian Mining Company SJSC
SAU:1211
|
248.9B SAR |
Loading...
|
|
| CN |
C
|
China Molybdenum Co Ltd
OTC:CMCLF
|
65.6B USD |
Loading...
|
|
| UK |

|
Anglo American PLC
LSE:AAL
|
41B GBP |
Loading...
|
|
| RU |

|
GMK Noril'skiy Nikel' PAO
MOEX:GMKN
|
2.6T RUB |
Loading...
|
Market Distribution
| Min | -16 177 900% |
| 30th Percentile | -544.7% |
| Median | -27.7% |
| 70th Percentile | 3.1% |
| Max | 3 174 540% |
Other Profitability Ratios
Artemis Resources Ltd
Glance View
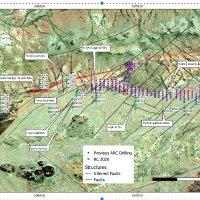
Artemis Resources Ltd. engages in the exploration and development of mineral properties. The company is headquartered in Perth, Western Australia. The company went IPO on 2007-03-16. The firm has two major projects in Western Australia, the Greater Carlow Castle gold-copper-cobalt project in the West Pilbara and the Paterson Central project in the East Pilbara. The Carlow Castle gold, copper and cobalt Project is located in the West Pilbara region of Western Australia, which is approximately 45 kilometers (km) east of the city of Karratha. The Carlow Castle Mineral Resource covers a strike length of approximately 1.2 km. The Paterson Central Gold-Copper Project covers approximately 605 square kilometers and is located in the Yaneena Basin of the Paterson Province, which hosts mineral deposits, such as the Telfer Gold-Copper Mine, Winu copper-gold deposit, Nifty Copper Mine, and the Havieron gold and copper deposit. The project forms a 100% owned exploration tenement E45/5276. The Radio Hill processing plant is approximately 35 kilometers through bitumen road from Karratha.
See Also
Net Margin is calculated by dividing the Net Income by the Revenue.
The current Net Margin for Artemis Resources Ltd is -1 846.9%, which is above its 3-year median of -38 170.2%.
Over the last 3 years, Artemis Resources Ltd’s Net Margin has increased from -22 543.1% to -1 846.9%. During this period, it reached a low of -190 641.5% on Dec 31, 2022 and a high of -1 846.9% on Jun 30, 2025.

